Tool optimization for business continuity: build a resilient tech stack
The average 20 person business runs 31 SaaS tools. Here is the framework that turns that sprawl into a lean, outage proof operation.
 By Ishan Vats · Founder of IV Consulting · 150+ ops transformations over 10+ years
Some links below are affiliate links. If you buy through them we may earn a commission, at no extra cost to you.
 NotionStack health hub
 SlackTier 1 comms
 CRMClient data record
 MakeMonitored flows
 ZapierBackup pathways
Tool optimization for business continuity is the systematic process of auditing, rationalizing, integrating, and continuity planning your tech stack so it delivers maximum operational value with minimum disruption risk. It is not a one time cost cutting exercise. It is the discipline that lets your business keep performing through vendor outages, price shocks, and integration breaks, because the protocols were built before the crisis, not during it.
The definition
Your tools are running your business. Are they qualified for the job?
Picture your last unexpected tool outage. Not a five minute glitch, a real one. The project management platform your delivery team lives in goes down at 9 AM on a client deadline day. Or the integration between your CRM and your billing system silently breaks and nobody notices for three weeks. Or a vendor announces a 40% price increase with 30 days notice, and you realise you have built 12 critical workflows on their platform with no migration plan.
These are not hypotheticals. They are the operational reality for businesses that grew their tool stacks reactively: adding tools when a pain appeared, never removing them when that pain was solved, never auditing whether the current combination is resilient, efficient, or even coherent.
A working definition
Tool optimization for business continuity is the systematic process of auditing, rationalizing, integrating, and continuity planning your business technology stack so that it delivers maximum operational value, minimum disruption risk, and the resilience to maintain core business functions through vendor outages, pricing changes, team transitions, or unexpected growth.
It is distinct from simple software rationalization (cutting tools to save money) and from classic business continuity planning (which focuses on disaster recovery). Tool optimization for continuity sits at the intersection of both: it is about building a tech stack that is simultaneously lean enough to operate efficiently and robust enough to keep functioning when something inevitably breaks.
The four properties of an optimized, continuity ready stack
- Purposeful: every tool has a defined function, a defined owner, and a measured ROI.
- Integrated: data flows between tools without manual re-entry or error prone copy paste.
- Redundant where it matters: mission critical functions have backup solutions or documented manual fallback protocols.
- Audited regularly: the stack is reviewed on a defined cadence against current business needs, not inherited from a previous growth stage.
Most businesses have none of these four properties operating systematically. They have a collection of tools assembled over time, under pressure, by different people with different priorities. The result is a stack that costs more, delivers less, and creates more risk than it should.
The numbers
The true cost of an unoptimized tool stack
The subscription line items are visible. The real cost of tool sprawl is not, and the gap between what leaders think the problem costs and what it actually costs is typically a factor of 5 to 10.
Cost 1: redundant subscriptions and underutilised licenses
The average business with 20 to 30 employees carries 4 to 7 pairs of redundant tools: two project management platforms, two document storage systems, two communication channels, because different teams adopted different tools at different times and nobody unified the stack. Underutilisation compounds this. Across all SaaS tools, average utilisation runs 37 to 61% of licensed seats, with many tools used by fewer than half the team that has access.
Cost 2: context switching and cognitive overhead
Research on knowledge worker productivity consistently finds that switching between applications interrupts deep work and costs an average of 23 minutes of recovery time per context switch. In a business where team members move between 8 to 12 tools per day, which is typical in an unoptimized stack, the context switching cost alone represents 2 to 3 hours of lost productive capacity per person per day. This number is never on any budget report. It is invisible until someone measures it.
Cost 3: integration failures and data integrity breaks
Every point where data moves between tools manually, or via a brittle integration, is a potential failure point. A CRM to invoicing disconnect that sends an invoice with wrong figures. A project management to reporting gap that means leadership decides on two week old data. IV Consulting finds that businesses with unoptimized stacks spend an average of 6 to 9 hours per week per senior operator on integration related error correction. That is time that could move the business forward.
Cost 4: business continuity exposure
This is the cost nobody wants to calculate until it is too late. If your top 3 mission critical tools went down simultaneously today, how long would it take to recover full operational capacity? For most businesses without a continuity plan, the honest answer is days to weeks, with significant client impact, potential contract breach exposure, and revenue loss. A single significant outage event often costs more than a full year of tool optimization investment.
The framework
The 5 pillar tool optimization framework
Deployed in sequence, these five pillars transform an inherited, reactive tool stack into an intentional, resilient operational infrastructure.
Stack audit and rationalisation
You cannot optimize a stack you cannot see. Pillar 1 is a complete inventory of every tool in the business, across every team, including shadow IT: the tools individuals adopted without central visibility. Most businesses discover 20 to 40% more tools than leadership thought were in use. For each tool, capture its function, its owner, its usage and utilisation rate, its full annual cost, its criticality, any redundancy, and its continuity status.
Mission critical tiering
Not all tools are equal. The most important outcome of Pillar 1 is a clear, agreed tiering of your stack by business criticality. You cannot protect everything equally, so you must know what needs protecting most. Tier 1 tools (email or Notion-backed comms, CRM, delivery platform, finance) stop the business when they fail and require full continuity protocols. Tier 2 tools are disruptive but manageable with workarounds. Tier 3 tools enhance productivity but their loss does not materially affect operations.
Integration architecture and data flow mapping
The most fragile parts of any stack are the connections between tools, the points where data moves, transforms, or triggers actions across system boundaries. Integration failures are the leading cause of silent operational breakdowns. Pillar 3 maps every data flow: where data originates, where it moves, how it moves (native integration, API, middleware like Zapier or Make, or manual process), and what breaks in your operations if that flow fails. The output is an integration risk map across high risk manual flows, fragile automated flows, monitored automated flows, and redundant flows.
Continuity protocol design for mission critical tools
For every Tier 1 tool, you need a documented continuity protocol that answers four questions before a crisis, not during one. What is our Recovery Time Objective (RTO)? The maximum time this tool can be unavailable before unacceptable impact. What is our primary fallback? The first response to unavailability, the one your team can execute under pressure. Where does the critical data live and how do we access it without the primary tool? The question most plans skip and most crises reveal as fatal. Who is the designated response lead and what is the escalation path? A protocol without a named owner will not be actioned.
Governance, review cadence, and stack health monitoring
The most common failure mode is that optimization happens once, then the stack immediately drifts back toward sprawl. Pillar 5 prevents this with three mechanisms. A tool intake process: a lightweight 20 minute review before any new tool is adopted. A quarterly stack review: a 60 to 90 minute review that surfaces consolidation, integration risk, and contract changes. And a stack health dashboard: a simple Notion AI database or shared spreadsheet that maintains the inventory, ownership, tier, continuity status, and renewal dates for every tool. Updated quarterly, it takes 30 minutes to maintain.
Score your stack
The tool continuity risk matrix
For each Tier 1 tool, score each dimension from 0 (not in place) to 3 (fully addressed). A total below 8 for any Tier 1 tool represents an unacceptable continuity risk.
| Continuity dimension | Scoring criteria (0 to 3) | What 3 looks like |
|---|---|---|
| Documented fallback protocol | 0 none, 1 informal, 2 documented | Tested in the last 6 months |
| Data access without primary tool | 0 no plan, 1 known location, 2 accessible export | Automated backup plus verified restore |
| Named continuity response owner | 0 nobody, 1 informal, 2 documented | Trained and practiced |
| Recovery Time Objective defined | 0 undefined, 1 discussed, 2 documented | Validated against actual business impact |
| Team awareness of fallback | 0 nobody knows, 1 owner knows, 2 team leads know | Full team trained |
Read your total like this: 13 to 15 is continuity ready, review annually. 9 to 12 is partially protected, close the 1 or 2 gaps within 30 days. 5 to 8 is high risk, a tool outage today would cause multi day recovery, build the protocol within 60 days. 0 to 4 is critical exposure, a single point of failure with no safety net, and your highest priority continuity risk. Address it before anything else.
The rollout
The 90 day tool optimization sprint
The full framework does not need to deploy simultaneously. This sprint delivers the highest impact outcomes first, builds momentum through quick wins, and closes the most critical gaps before moving to governance.
Days 1 to 21: full stack audit and tiering
Complete the inventory, assign a business owner to each tool, calculate full annual cost, identify redundant pairs and underutilised licenses, and apply the Tier 1 / 2 / 3 classification to every tool. Quick win: cancel or downgrade the 3 to 5 most obvious redundant tools immediately. Most businesses recover meaningful cost in the first three weeks, often covering the engagement before the deeper work is complete.
Days 22 to 45: mission critical protocols
Build continuity protocols for all Tier 1 tools, then run a 45 minute tabletop test per tool. Most teams find 2 to 4 gaps per tool on the first test. Document and close them, then schedule a second test 30 days later to validate.
Days 46 to 70: integration remediation
Map the integration architecture, prioritise the top 3 to 5 risks, and remediate. The question is: which integrations, if they broke silently for 7 days, would cause material client or revenue impact? Those need immediate fixes. The rest schedule into the next quarter.
Days 71 to 90: governance baseline
Deploy the tool intake process, set up the stack health dashboard, schedule the first quarterly review, and brief the team. By day 90 the fragility that was invisible 90 days ago is documented, addressed, and monitored.
The proof
A 22 person ops firm cut tool costs 38%
A 22 person operations consulting firm, growing through referrals, had a persistent sense that the tool stack had grown beyond control but no bandwidth to address it systematically. The delivery team was using 3 different project management tools across client engagements, and a pricing increase from their primary reporting platform had triggered a 90 day notice to migrate, with no migration plan in place.
The Pillar 1 audit revealed 47 active tools (leadership had estimated 28), including 6 redundant pairs, an analytics tool used by one person for one client report, and 3 Tier 1 tools with zero continuity documentation.
What was built
- Full 47 tool inventory with tier classification, cost allocation, utilisation rates, and owner assignment.
- Rationalization plan that eliminated 11 tools and consolidated 3 platform pairs, phased over 8 weeks to avoid disruption.
- Continuity protocols for all 5 Tier 1 tools, including tabletop tested fallback procedures and data access plans.
- Unified delivery platform replacing 3 separate tools, with a documented migration playbook.
- Integration remediation for 4 high risk manual flows in the critical path of client reporting.
| Metric | Result at 90 days |
|---|---|
| Monthly SaaS spend | Reduced 38% |
| Single points of failure (Tier 1 with no plan) | 3 eliminated, 0 remaining |
| Weekly team hours recovered | 14 hours per week across delivery team |
| High risk manual integration flows | 4 eliminated, replaced with monitored automations |
| Reporting platform migration | Completed 3 weeks early with zero client impact |
| Tool outages handled post implementation | 2 outages, both resolved within 35 minutes |
The governance mechanisms have kept the stack at 36 intentional tools, rationalized from 47, with no uncontrolled growth in the 6 months following implementation. That operational resilience did not come from new technology. It came from applying a structured framework to the technology they already had.
Self diagnosis
7 signs your stack is creating continuity risk right now
You do not need an outage to know whether your stack is a continuity liability. These warning signs indicate a stack accumulating risk, even before it triggers a visible crisis.
- You cannot name the business owner of every tool in your stack without looking it up.
- Your team uses more than one tool for the same core function.
- Critical data exists only inside a single tool with no backup export or fallback access plan.
- You have integrations built by someone who has since left the company.
- You are paying for tool licenses you cannot confirm are being actively used.
- A vendor has increased prices or announced deprecation and you have no migration plan.
- Your team manually copies data between tools at any point in a client facing workflow.
If three or more apply, you have a live continuity risk that will surface as an operational crisis. The question is whether it happens on your terms (you audit and fix it proactively) or on the market's terms (a vendor outage, a price shock, or an integration failure forces an emergency response).
FAQ
Questions ops leaders ask before they start
What does tool optimization for business continuity actually mean?
How many tools should a 20 person business be running?
What is the biggest continuity risk in a typical business tool stack?
How long does a tool optimization engagement typically take?
Do we need a dedicated IT person to implement tool optimization?
How do we prevent tool sprawl from returning after we have rationalized the stack?
Ishan Vats
Founder, IV Consulting · operations & systems consultant
I build operating systems and automations for growing teams. 150+ ops transformations over 10+ years. If you want yours mapped and built right, I'll do it with you on a free call.
Book a free strategy call →Keep reading
Related guides and work
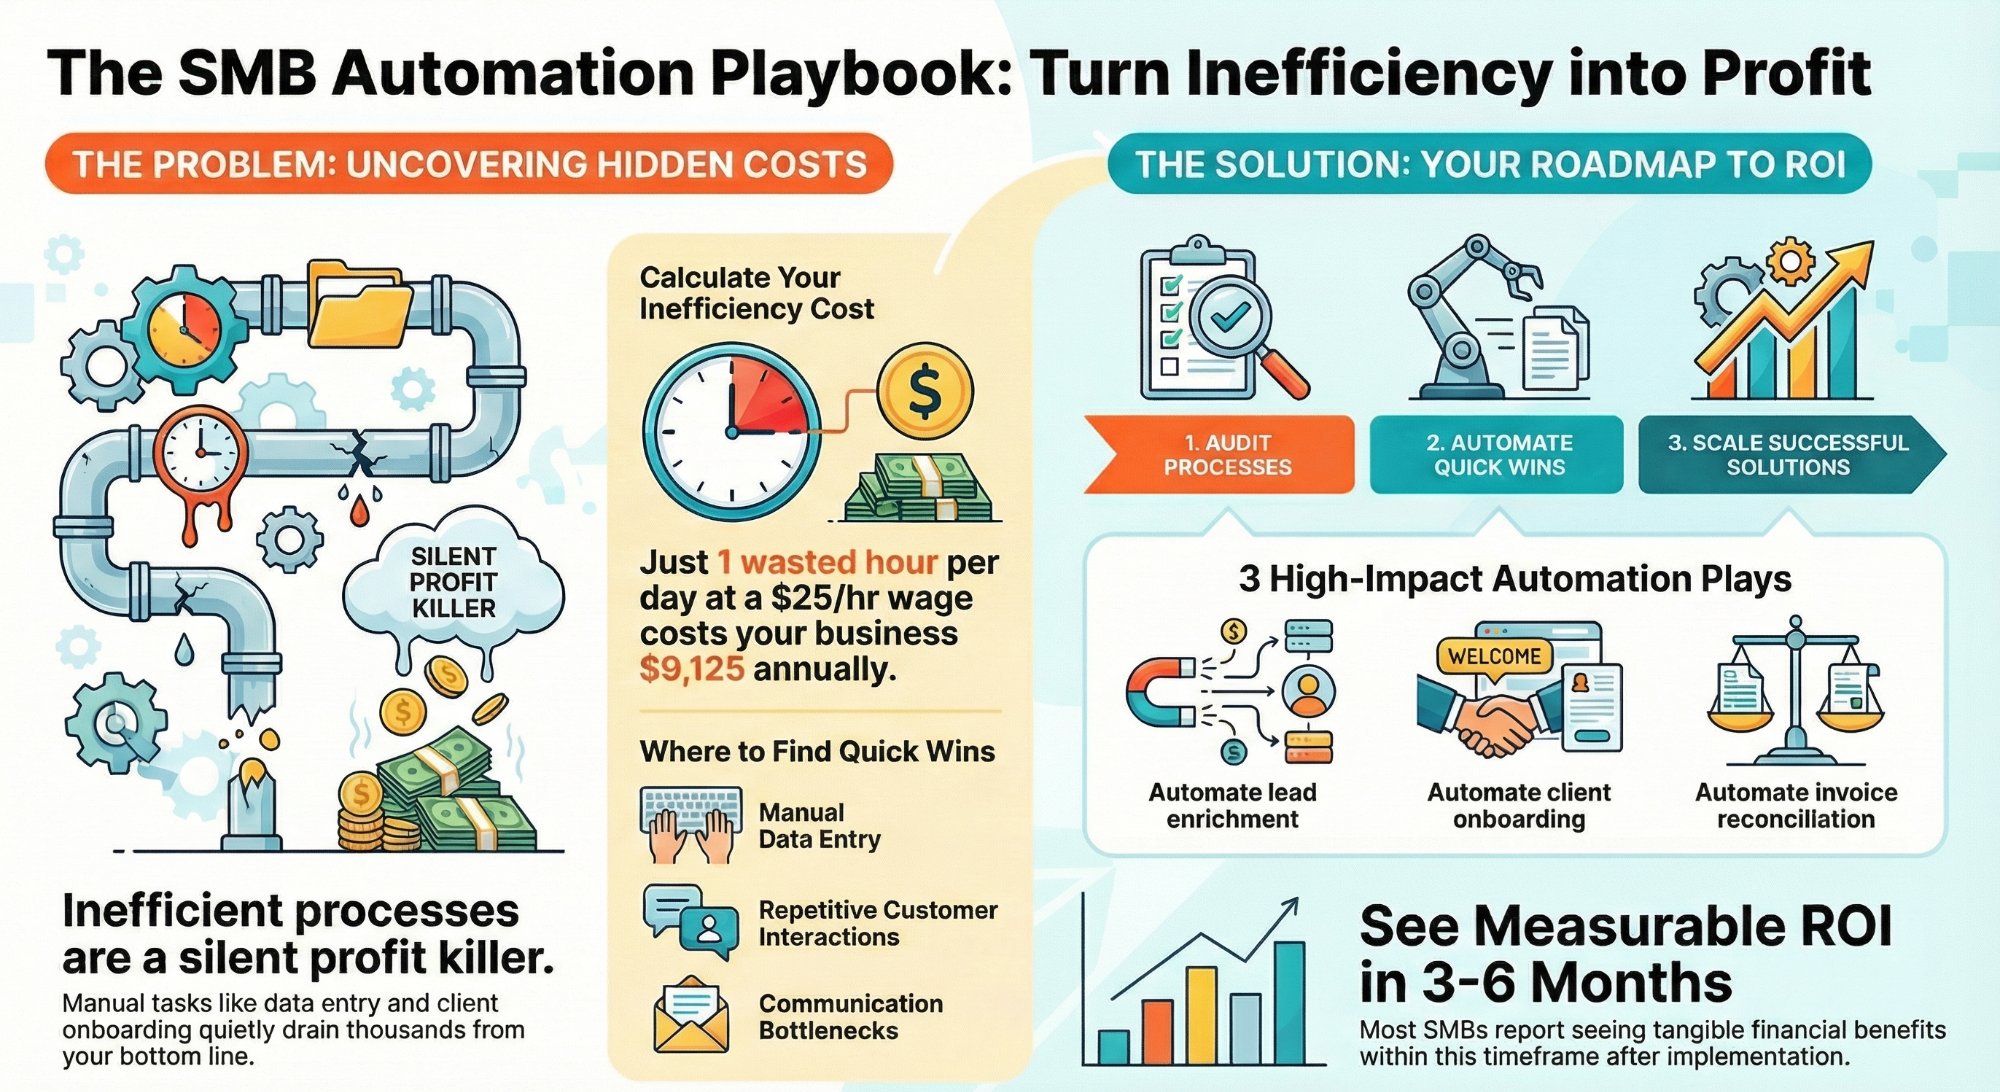
How much are inefficient processes costing your SMB?
The hidden cost of broken process, and the fastest ways to fix it.
Read the guide →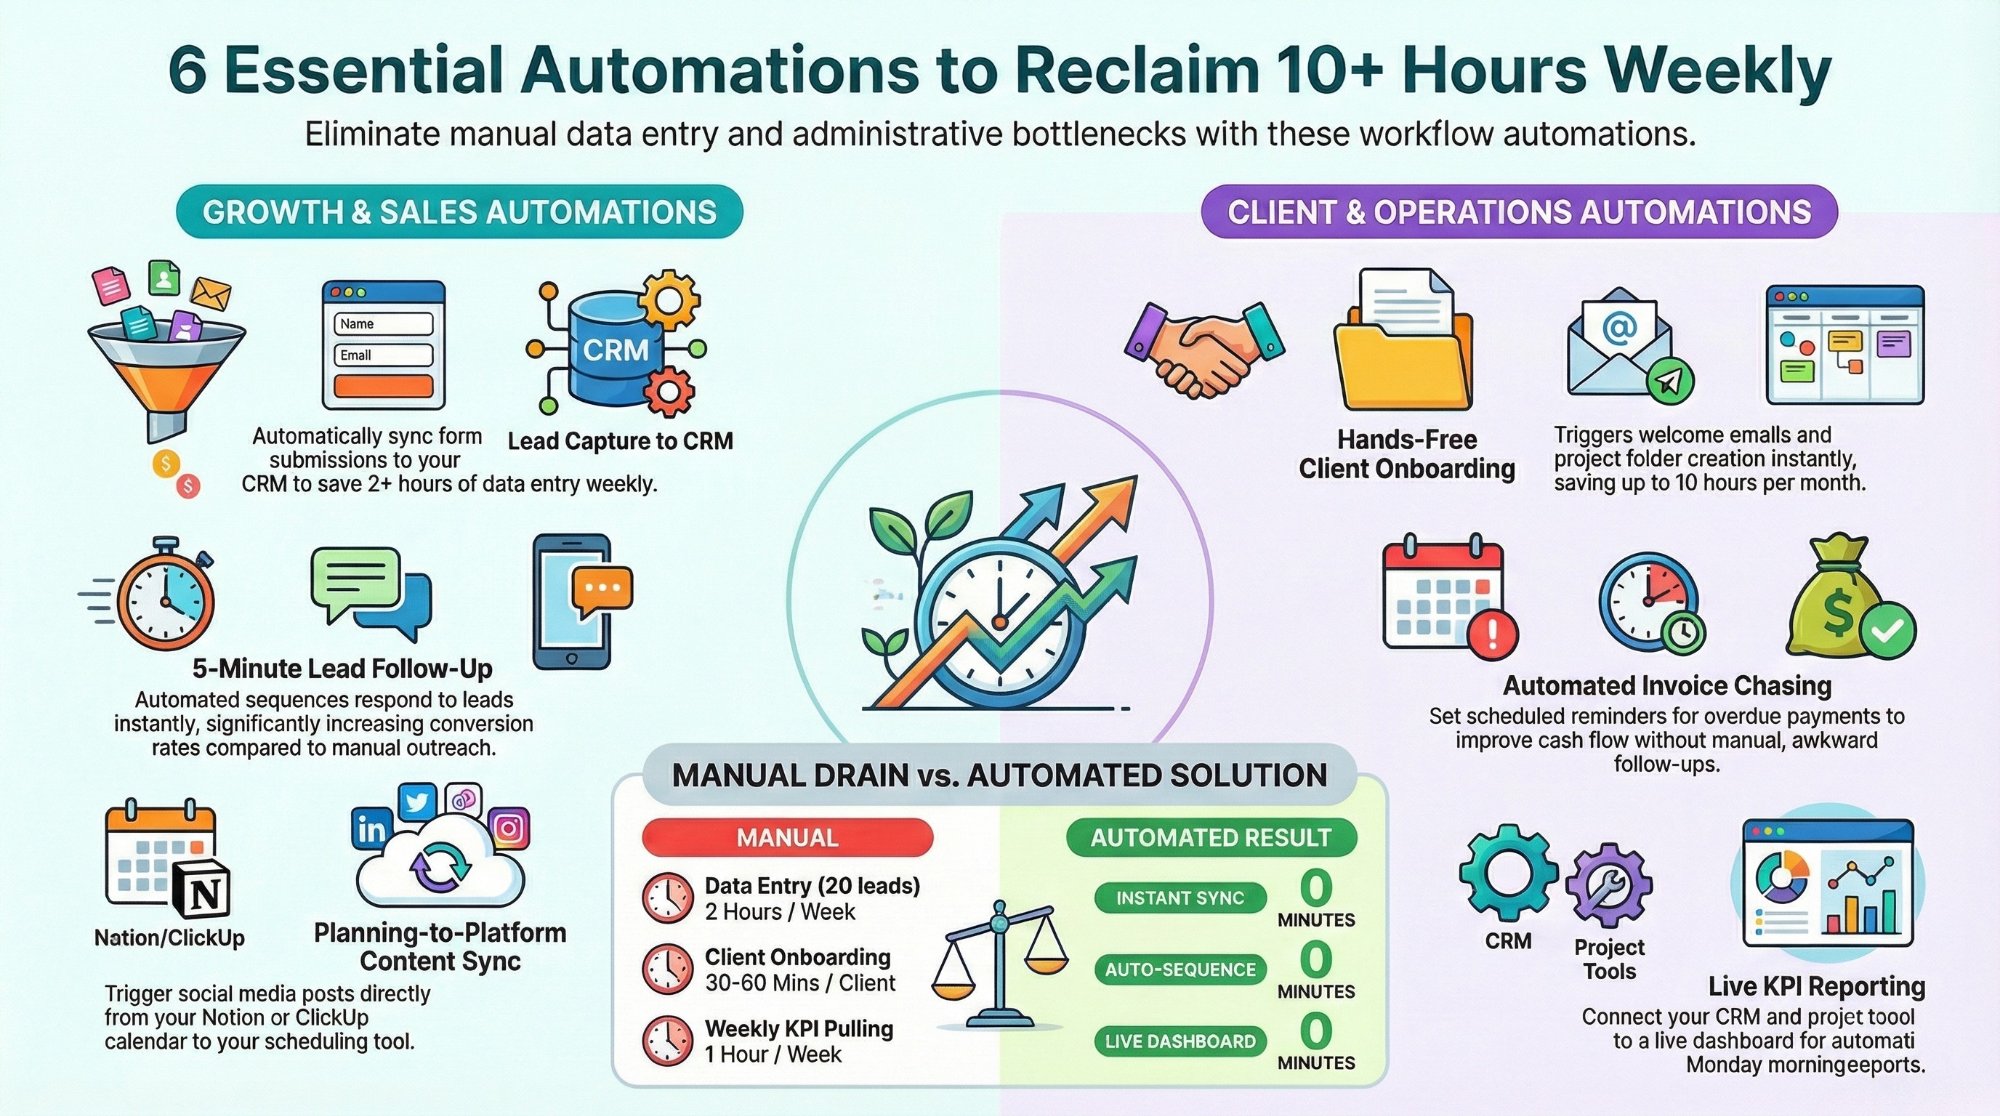
Workflow automations every business owner must set up
The starter automations that reclaim 10+ hours a week and harden your flows.
Read the playbook →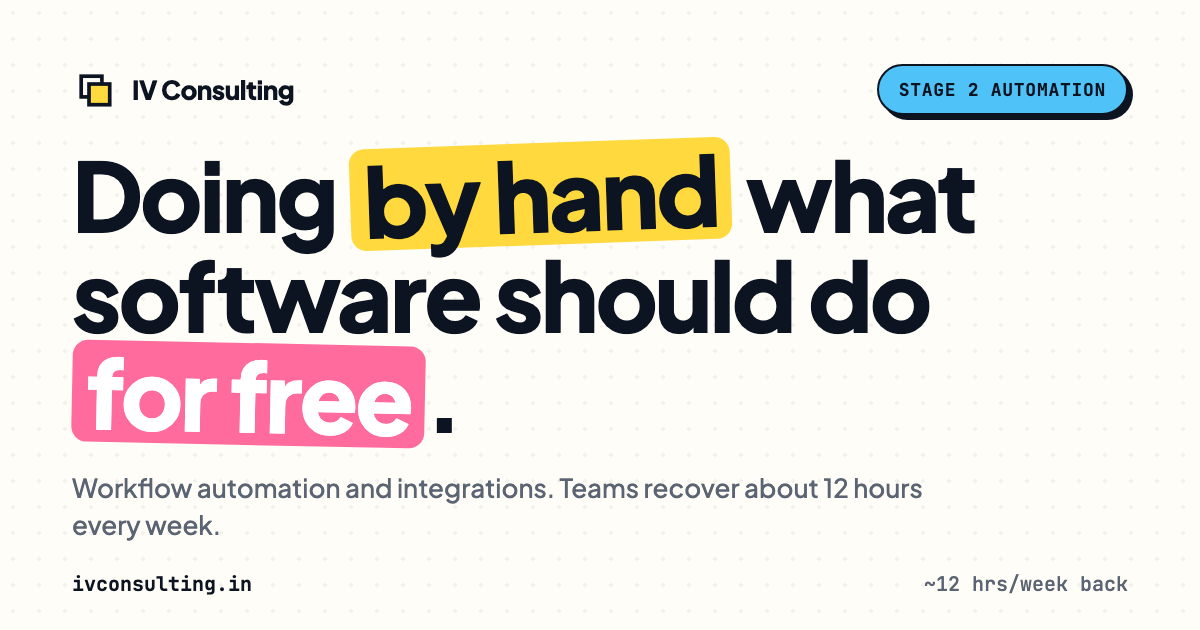
The Automation stage, built for you
Monitored, redundant flows in the critical path. The busywork gone, the risk closed.
See the offer →Want your automation stack built for you?
Book a free 30-minute strategy call. We will map your highest-ROI workflows and give you a build roadmap on the spot. If we are not the right team for you, we will say so and point you somewhere better.
Book a Free Strategy Call →Free 30-minute call. Honest take, even if that means "you do not need us yet."