Process improvement success stories: 5 real businesses, real results
Five companies that treated an operational problem as solvable, then solved it. The exact problem, the exact fix, and the exact numbers 90 days later.
 By Ishan Vats · Founder of IV Consulting · 150+ ops transformations over 10+ years
Some links below are affiliate links. If you buy through them we may earn a commission, at no extra cost to you.
 Notion · System of recordPortals, SOPs, dashboards
 ClaudeAI-drafted reports
 ClickUpOwned processes
 SlackRouted alerts
Process improvement success stories prove that operational chaos is fixable, and usually fast. Across five real IV Consulting engagements, an agency cut client churn from 28 to 11 percent, a SaaS startup closed its Series A, a consulting firm tripled proposal output, an accounting firm recovered 75 hours a week, and an e-commerce brand cut its complaint rate from 31 to 8 percent. Every result came within 30 days, with no new headcount, at 8:1 to 22:1 ROI.
The case for proof
Why case studies beat frameworks every time
There is no shortage of process improvement frameworks. Lean. Six Sigma. Agile. Kaizen. OKRs. Most business owners have heard of most of them. What most owners are still missing is the answer to one concrete question: what actually happened when a company like mine tried to fix its operations?
Frameworks give you methodology. Case studies give you permission. Permission to believe the chaos you are living in is fixable. Permission to believe the investment of time and money is worth it. Permission to believe other people have been in your exact situation and found a way through.
The five stories here come from IV Consulting client engagements across 2024 to 2026. Different industries, different sizes, different problems. All five shared one thing: they had tolerated an operational problem for longer than it deserved, because they could not yet see a clear path to fixing it.
Story 1 · Brand agency
The agency that stopped losing clients to its own chaos
Brand strategy and creative agency. Team: 12 people. Engagement: 10 weeks.
The problem
This agency had a reputation problem that had nothing to do with the quality of their creative work, which was genuinely excellent and award-nominated two years running. But clients were leaving at the 3 to 6 month mark with one consistent complaint: it feels chaotic to work with you.
Clients did not know where their project stood unless they chased someone. Feedback came back in email chains, WhatsApp messages, and Loom videos that took hours to consolidate. Deliverables arrived without context on what had changed or which version was final. Internally, the account manager was spending 3+ hours daily on status updates and version control. Annual client churn sat at 28%, with an average engagement length of 4.2 months, both trending the wrong way.
The intervention
The audit revealed three failure points: no structured feedback channel, no formal sign-off process, and no client-facing project visibility. The fix matched each one. First, a Notion client portal for every active engagement, holding live status, version-controlled deliverables, the active feedback thread, and approval history. Second, a structured feedback form with a deadline, a defined scope, and a sign-off mechanism that required the client to click approved before the next phase began. Third, a written decision rights framework defining which calls the account manager, the senior creative, and the founder could each make independently.
| Metric | Before to after (10 weeks) |
|---|---|
| Annual client churn rate | 28% to 11% |
| Average engagement length | 4.2 months to 7.8 months |
| Feedback consolidation per review round | 2.5 hrs to 35 min |
| Account manager daily coordination | 3.1 hrs/day to 0.8 hrs/day |
| Client NPS score | 34 to 61 |
Story 2 · B2B SaaS
The SaaS startup that closed its Series A by fixing onboarding
B2B SaaS platform. Team: 18 people. Engagement: 12 weeks.
The problem
Six months before a planned Series A raise, the lead investor delivered a piece of feedback that caught the team off guard. They liked the product and the metrics. Their concern: the company looked operationally immature for the stage it was claiming. The founder was visibly involved in decisions that should not need a founder, onboarding varied by whoever ran it, and most of the team described their role as whatever Priya needs help with rather than a defined function.
The internal picture confirmed it. New customers took 22 days to reach their first meaningful value moment. The founder was copied on 70% of client emails. Two of the three most critical processes lived entirely in the head of one employee.
The intervention
The 12-week programme rebuilt onboarding from scratch: a documented 14-day customer journey with touchpoints at days 1, 3, 7, and 14, an automated check-in sequence, a Notion-based client workspace, and a clear sales-to-success handoff. Every new customer went through the same experience regardless of who managed the account. A decision rights framework removed the founder from the approval chain below a defined threshold, freeing roughly 11 hours of founder time per week. Finally, the 14 most critical processes were documented, structured in the team's project management tool, and a second person was cross-trained on each.
| Metric | Before to after (12 weeks) |
|---|---|
| Days to first customer value moment | 22 days to 7 days (68% faster) |
| Customer NPS | 41 to 65 (+24 points) |
| Founder hours/week in team-ownable decisions | 11 hrs to under 2 hrs |
| Processes documented with named owners | 3 to 14 |
| Customer churn in month 1 to 3 | 18% to 7% |
| Series A outcome | Closed 14 weeks after engagement end |
Story 3 · Consulting firm
The consulting firm that tripled proposal output without hiring
Management consulting firm. Team: 9 consultants. Engagement: 8 weeks.
The problem
A boutique consulting firm was turning away work, not for lack of delivery capacity, but because it could not keep up with the proposal volume needed to win it. Every proposal started from scratch: research the client, build the scope, write the document, design the pricing. The average proposal took 14 hours. Delivery quality was inconsistent too, a client working with Partner A had a materially different experience than one working with Partner B. Consultants were billing at 61% against a 75% target, with the missing 39% going into business development admin, coordination, and rework.
The intervention
The proposal process was rebuilt as a modular system: ten reusable scope blocks, a standard pricing model with defined variables, and a template a consultant could populate in 2 to 3 hours by adapting modules rather than starting blank. A Notion proposal library stored every completed proposal for reuse. Delivery was standardised around the three engagement types representing 80% of revenue, each with a playbook covering phases, templated deliverables, communication cadence, and a quality checklist. A weekly 45-minute pipeline review replaced the ad-hoc business development conversations.
| Metric | Before to after (8 weeks) |
|---|---|
| Average time to produce a proposal | 14 hrs to 4.5 hrs (68% faster) |
| Proposals produced per month (same team) | 6 to 18 (3x) |
| Consultant utilisation rate | 61% to 78% |
| Delivery rework instances per month | 8 to 10 down to 1 to 2 |
| Client satisfaction score | 7.1/10 to 8.9/10 |
Story 4 · Accounting firm
The professional services firm that got back 5.4 hours per person per week
Accounting and advisory firm. Team: 14 staff. Engagement: 6 weeks.
The problem
Every Monday morning, the team produced the same reports they had produced every Monday for four years. Client portfolio summaries, capacity trackers, WIP reports, billing summaries, revenue forecasts. Each pulled data from three or four places, was formatted manually in Excel, and emailed before 9am. Nobody had questioned it because the reports were useful. What nobody had calculated was the cost: an average of 6.2 hours per person per week across 14 people, or 86.8 hours of professional time weekly. The second problem was accuracy. Manual consolidation meant every report contained at least one figure needing a correction email by Tuesday, which in accounting is a credibility problem, not just a time problem.
The intervention
A six-week automation sprint mapped every report to its data sources, identified the manual steps, and built automated pipelines connecting the practice management system, billing platform, and time-tracking tool to a central Notion dashboard. The Monday report ritual was replaced with a single automated 7am digest linking to live dashboards. For the two most complex client-facing reports, a Claude-powered first draft pulled the current data and produced a formatted narrative that a senior adviser reviewed and sent, replacing 90 minutes of writing with 15 minutes of review.
| Metric | Before to after (6 weeks) |
|---|---|
| Weekly report production time per person | 6.2 hrs to 0.8 hrs |
| Total team hours recovered per week | 86.8 hrs to 11.2 hrs (75 hrs saved) |
| Report accuracy (no correction required) | ~70% to 98% |
| Time for complex client narrative report | 90 min to 15 min (AI-assisted) |
Story 5 · E-commerce
The e-commerce brand that stopped losing orders through manual gaps
Direct-to-consumer e-commerce brand. Team: 22 people. Engagement: 9 weeks.
The problem
This brand was growing at 40% year on year and losing customers at nearly the same rate, through operational failures that had nothing to do with the product. Orders shipped from the wrong warehouse. Complaint emails sat unanswered for 72+ hours. Reorder triggers were missed because they lived in a spreadsheet three people updated inconsistently. Refunds were processed manually, taking 8 to 12 days. As the operations manager put it: we have a fulfilment process, a customer service process, and an inventory process, but they are all in different places, owned by different people, and none of them talk to each other. The measurable damage: a 31% complaint rate on fulfilled orders, a 3.8-star average review (down from 4.6 two years prior), and an estimated revenue hit from customers who did not repurchase after a poor experience.
The intervention
The nine-week engagement built a connected operational infrastructure where the three process areas could communicate. Inventory moved from a shared spreadsheet to an automated system with reorder alerts at defined thresholds, owned by a single named person with a weekly review ritual. Customer service was rebuilt around a tiered SLA: triage within 2 hours, complaints resolved within 24 hours, refunds within 48 hours via an automated workflow replacing the 8 to 12 day manual process. A Notion SOP library gave every agent consistent answers to the 40 most common enquiry types. Fulfilment accuracy was addressed with a pre-dispatch QA checklist and a daily exception report, catching errors before they reached the customer.
| Metric | Before to after (9 weeks) |
|---|---|
| Complaint rate on fulfilled orders | 31% to 8% |
| Average review score (primary channel) | 3.8 stars to 4.5 stars |
| Average refund processing time | 8 to 12 days down to 48 hours |
| Customer service first response time | 72+ hrs to under 2 hrs |
| Inventory stockout incidents per month | 6 to 8 down to 0 to 1 |
What they shared
The 5 patterns in every success story
Five industries, five problems, five interventions. But five patterns show up in every single one.
1. They tolerated it too long
In every case the organisation knew the problem existed and had found a way to live with it rather than fix it. The average gap between recognising the problem and starting the fix was 14 months. The cost compounded the whole time.
2. The fix was operational, not headcount
Not one of the five needed to hire. Every result came from restructuring how existing people and tools worked, never from adding more of either.
3. Specific, not comprehensive
None tried to fix everything. Each identified the 2 to 3 highest-leverage gaps and built for those. Scope discipline was the prerequisite for speed of impact.
4. Results within 30 days
In all five, measurable improvement was visible within the first 30 days of implementation. Initiatives that take longer to show any signal are usually scoped wrong or built on un-standardised processes.
5. Return was a multiple of cost
ROI ranged from 8:1 to 22:1 within the first 12 months, not because the work was expensive to build, but because the cost of each problem was always larger than it looked from the outside.
| Business | Primary problem solved |
|---|---|
| Brand agency (12 people) | Client churn 28% to 11%, engagement length nearly doubled. |
| B2B SaaS (18 people) | Onboarding 22 to 7 days, NPS +24, Series A closed, early churn 18% to 7%. |
| Consulting firm (9 people) | Proposals 14 hrs to 4.5 hrs, output 3x, utilisation 61% to 78%. |
| Accounting firm (14 people) | 75 hrs/week recovered, report cost down 87%, accuracy ~70% to 98%. |
| E-commerce brand (22 people) | Complaint rate 31% to 8%, reviews 3.8 to 4.5 stars, refunds 8 to 12 days to 48 hrs. |
Start your own
The 4-week process improvement kickoff
Reading five success stories is useful. Starting your own is better. Here is a practical kickoff any owner can run without external support.
Week 1: the honest audit
Spend one hour on three questions: where does my team lose time to coordination, rework, or unclear ownership? Where do customers consistently hit friction? And what is the one problem that, if fixed, would most move revenue or morale?
Then ask your team. A 20-minute conversation around "what takes longer than it should, more than twice a week?" surfaces your top 3 to 5 friction points more accurately than any framework. For a deeper structure, use our process improvement framework for small teams.
Week 2: pick one problem, document reality
Resist fixing everything. Pick the single highest-pain problem from week one. Then document how it actually works today, not how it should work. Record a Loom, draw a process map, write the 5 to 10 steps as they really happen. This is your baseline.
Week 3: build the minimum viable fix
Design the simplest possible improvement. Not a comprehensive redesign, not a new tool stack. The smallest change that removes the specific friction you found. Build it into your existing tools wherever possible, since the fewer new behaviours required, the higher the adoption rate.
Week 4: run it, measure it, decide next
Run the improved process for one week and measure the specific friction it was designed to address. If it improved, it is your new standard: assign an owner, document it, move to the next problem. If it did not, diagnose why before building anything else. The measurement step is not optional. Without it you are operating on faith.
FAQ
Questions people ask before they start
How long does it typically take to see results from a process improvement initiative?
Do I need an external consultant to run a process improvement initiative?
What if my team resists the process changes?
How do I know which process to fix first?
Can AI tools help with process improvement?
What is a realistic ROI expectation for a process improvement initiative?
Ishan Vats
Founder, IV Consulting · operations & systems consultant
I build operating systems and automations for growing teams. 150+ ops transformations over 10+ years. If you want yours mapped and built right, I'll do it with you on a free call.
Book a free strategy call →Keep reading
Related guides and work
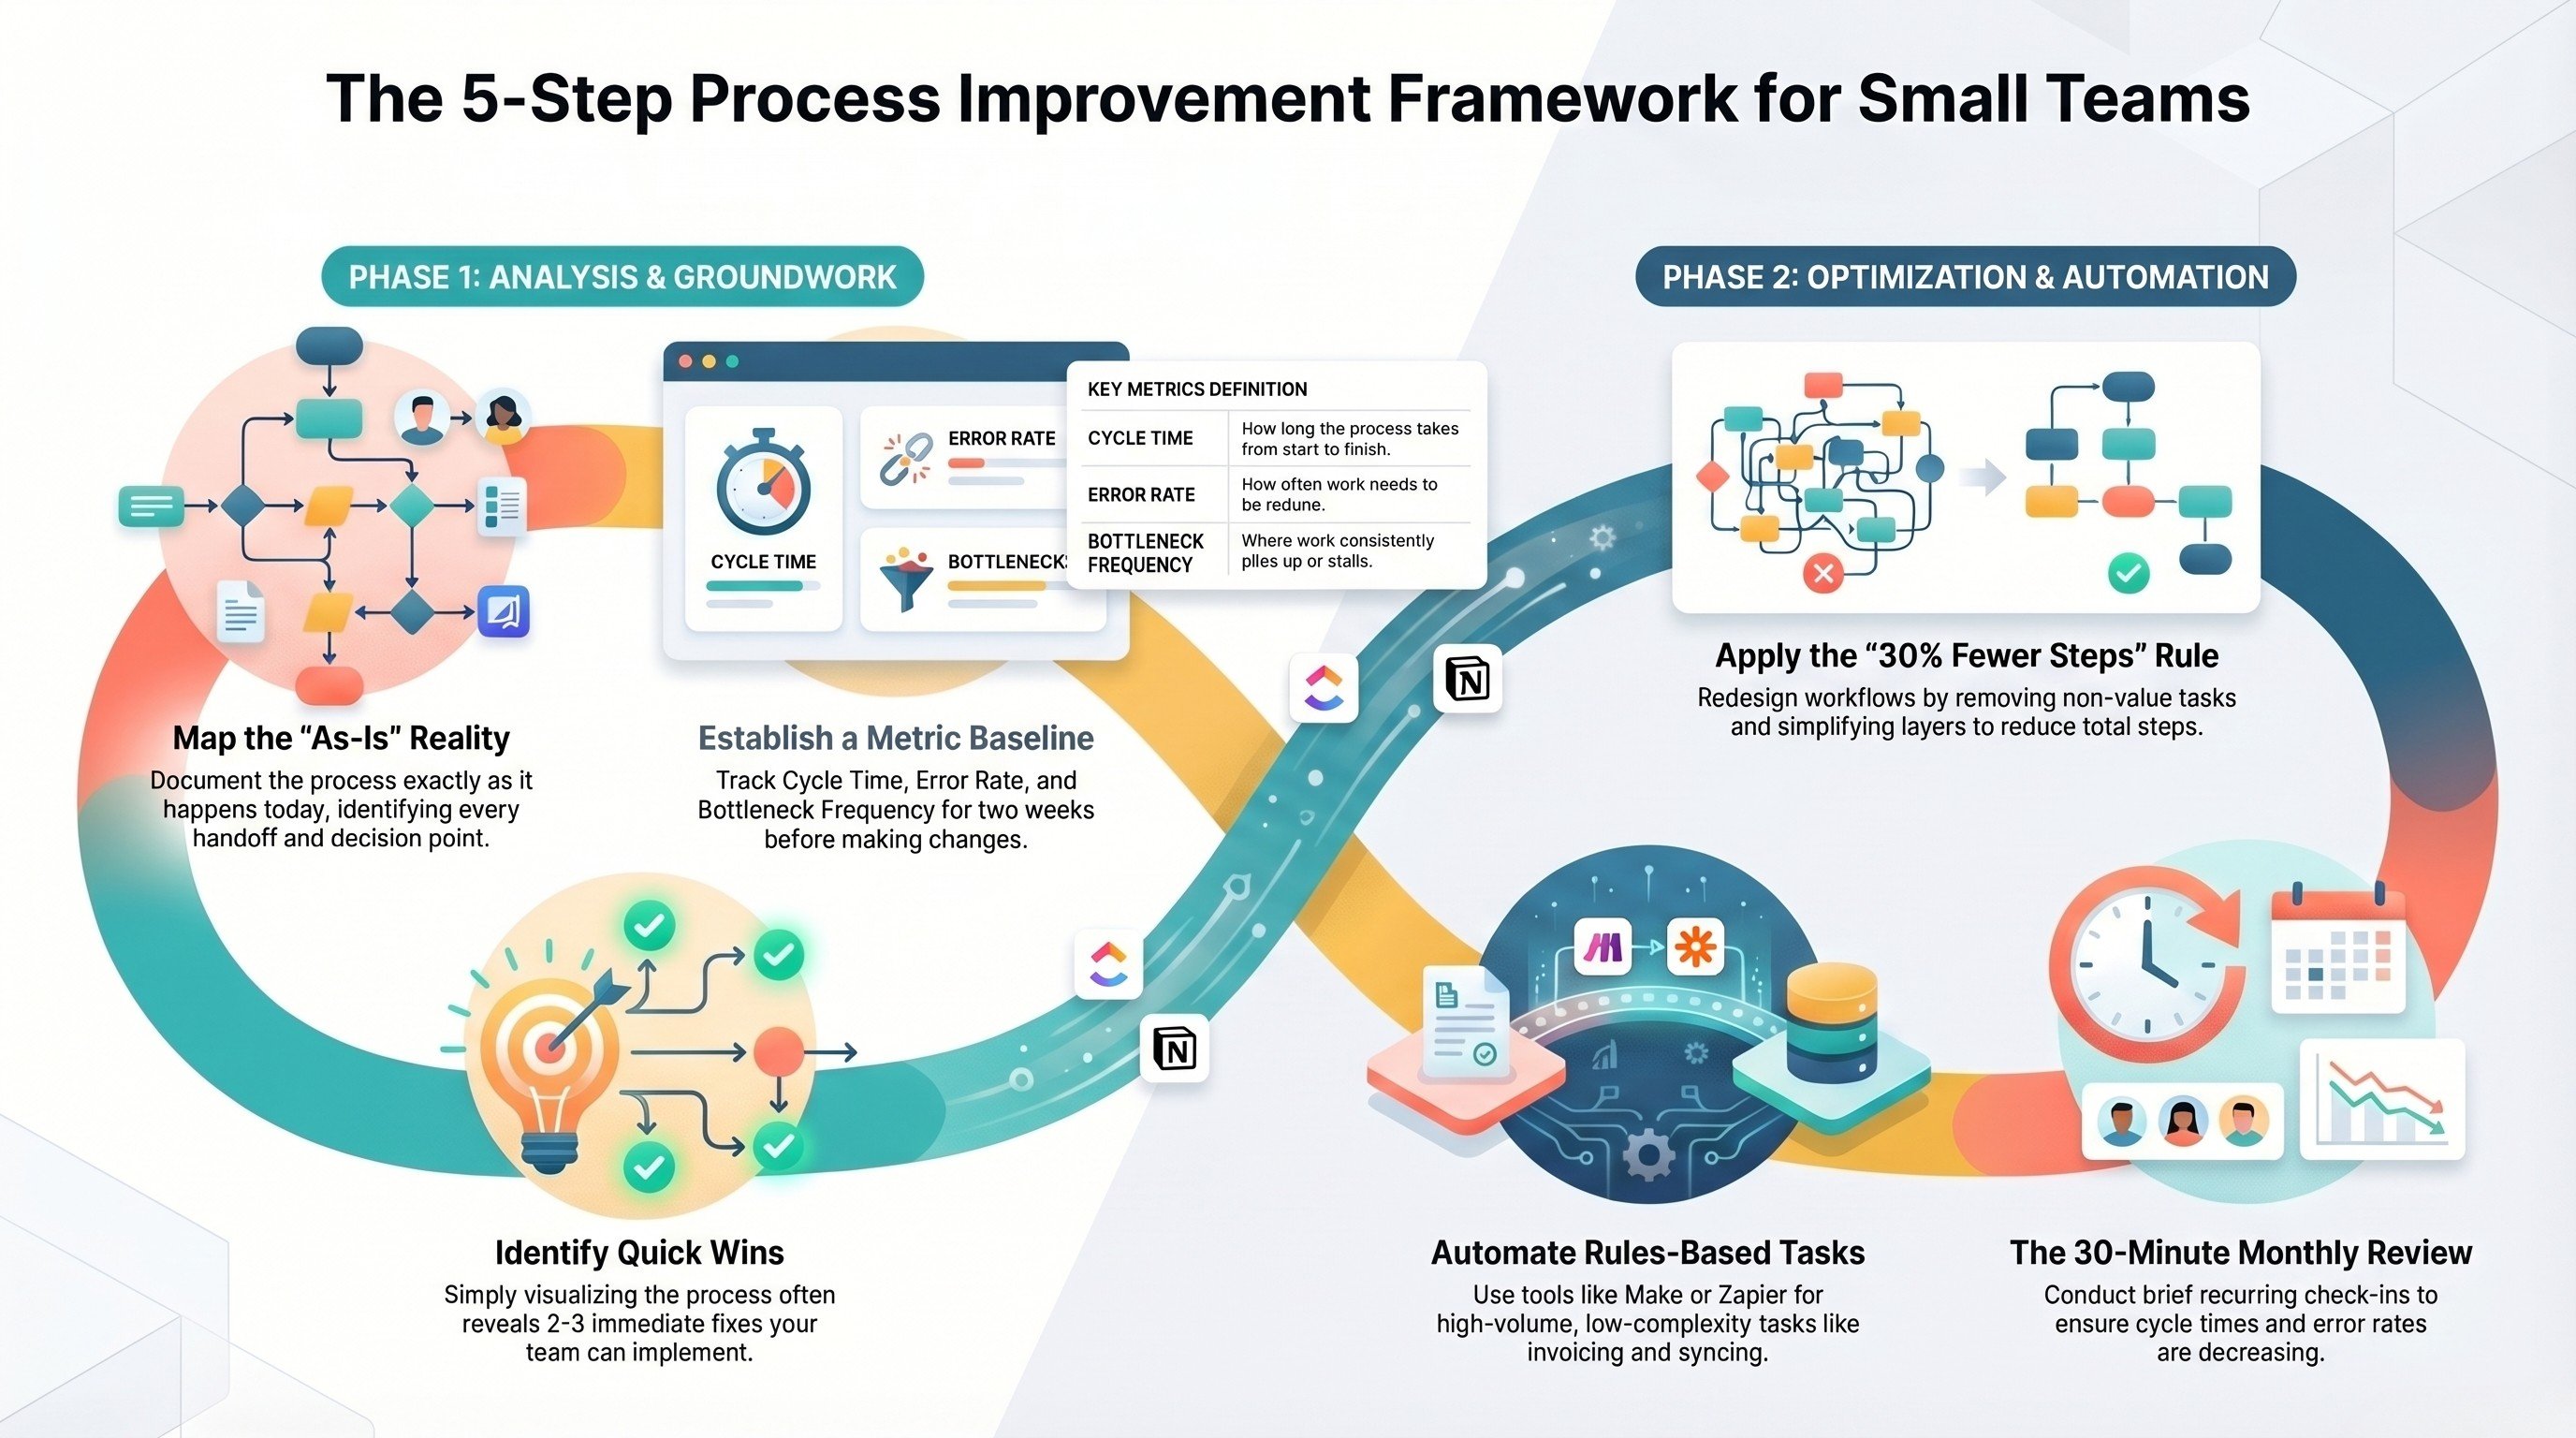
A process improvement framework for small teams
The repeatable method behind every story above, structured so your team can run it.
Read the framework →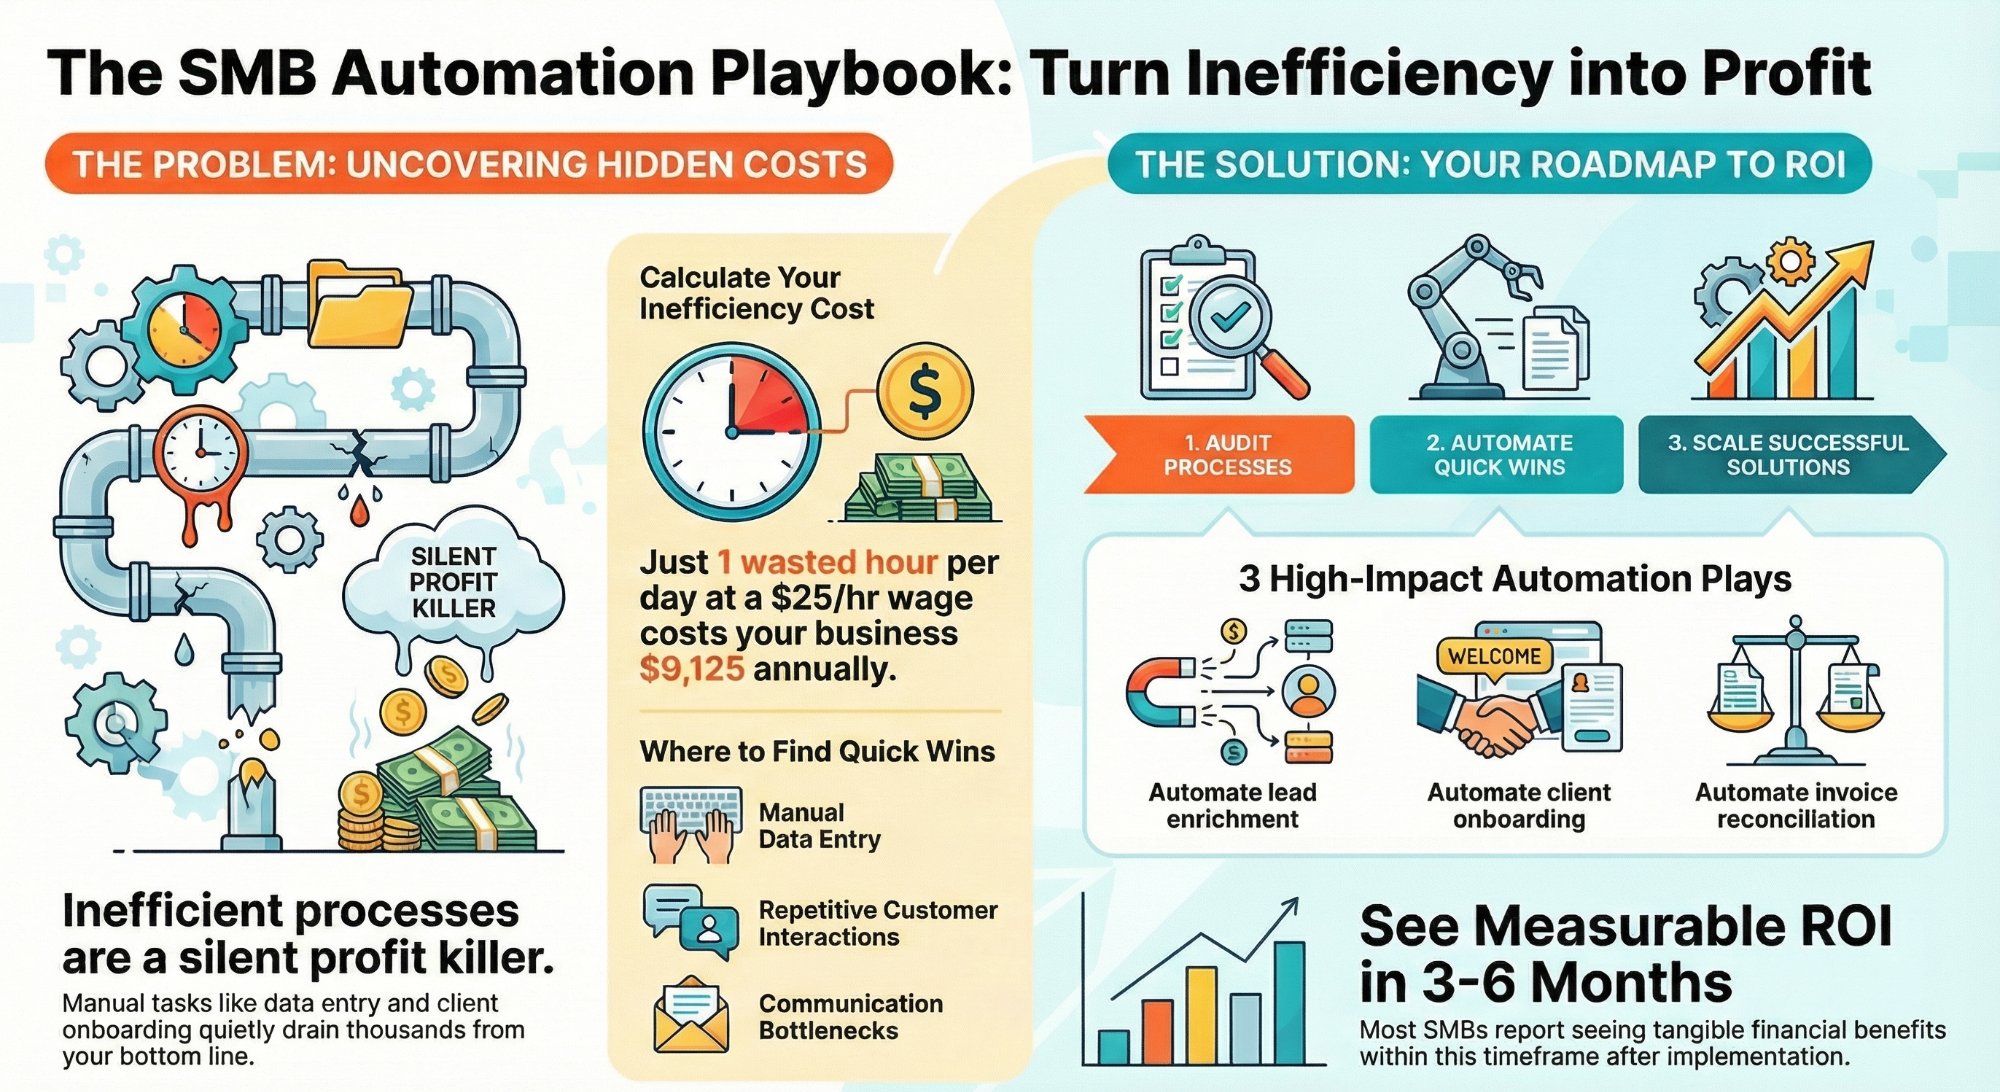
How much are inefficient processes costing your SMB?
Put a real number on the chaos before you decide what to fix first.
Read the breakdown →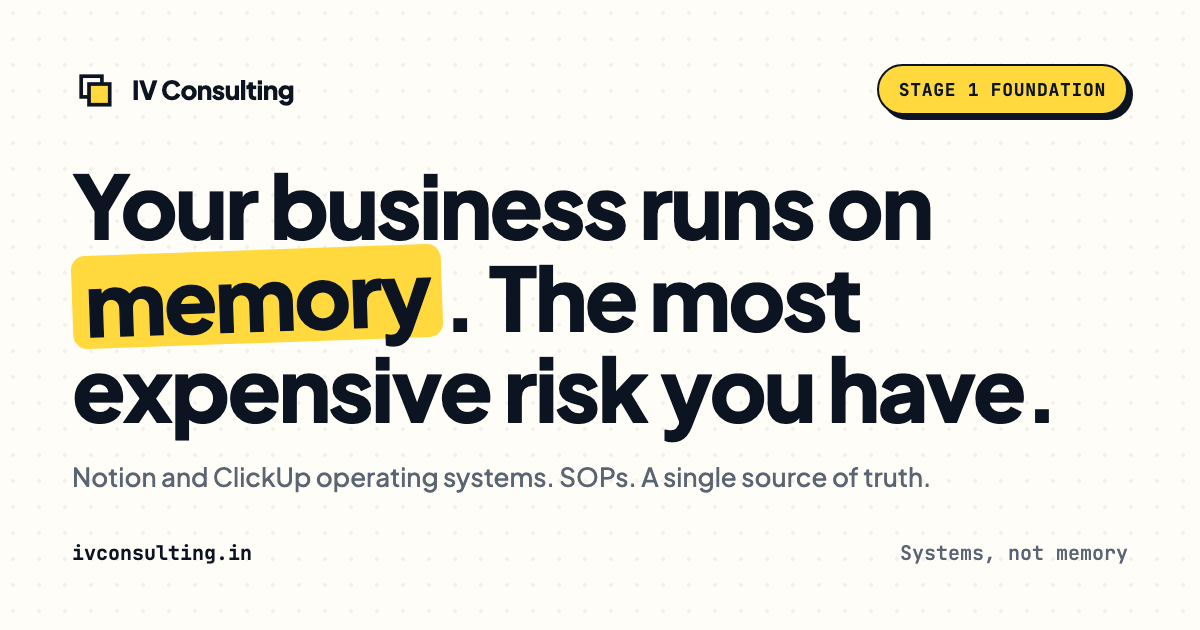
The Foundation stage, built for you
The audit-to-system engagement behind these results: your operations made fixable.
See the offer →Want your automation stack built for you?
Book a free 30-minute strategy call. We will map your highest-ROI workflows and give you a build roadmap on the spot. If we are not the right team for you, we will say so and point you somewhere better.
Book a Free Strategy Call →Free 30-minute call. Honest take, even if that means "you do not need us yet."