Improving logistics process efficiency with the OPTIC Framework
Most operations run a hidden tax: 25 to 35 percent of total capacity lost to avoidable waste. Here is the five phase method to find it and recover it.
 By Ishan Vats · Founder of IV Consulting · 150+ ops transformations over 10+ years
Some links below are affiliate links. If you buy through them we may earn a commission, at no extra cost to you.
 ClickUpSOPs and sprints
 NotionProcess maps
 MondayOps dashboard
Improving process efficiency in logistics and operations is a process design problem, not a people problem. The average SME operation loses 23 to 31 percent of its capacity to the 7 forms of operational waste. The OPTIC Framework recovers it in five phases: Observe, Pinpoint, Transform, Integrate, and Calibrate, deployed in a structured 90 day sprint. Fix the process first, then automate it. In that order, always.
The myth
Your operation runs a hidden tax on every order
Most logistics and operations leaders can tell you their throughput volume, their on time delivery rate, and their cost per order. What almost none of them can tell you is how much of their total capacity is consumed by avoidable waste: the unnecessary movement, the repeated data entry, the waiting between handoffs, the exception handling that happens because a standard process does not exist or is not followed.
This is the hidden efficiency tax. It is invisible because it is embedded in the normal. It looks like a busy warehouse. It sounds like a team working hard. But capacity utilisation and efficiency utilisation are not the same thing. A team can run at 95 percent capacity while operating at 65 percent efficiency, spending 30 cents of every operational dollar on activities that would not exist in a well designed process.
What process efficiency actually means
Process efficiency in logistics and operations is the ratio of value creating activity to total operational activity within a workflow. In a typical pick, pack, and ship operation, a time and motion study reveals that less than 55 percent of an operator's shift is spent on value creating work. The other 45 percent goes to searching for item locations, waiting for inbound information, handling exceptions, re entering data across systems, and unnecessary movement due to poor layout. Improving efficiency means reclaiming that 45 percent, not asking operators to work faster.
Name it to fix it
The 7 forms of operational waste in logistics
Lean manufacturing named 7 forms of waste. In logistics and operations they manifest differently, but the impact on efficiency and cost is identical. You cannot eliminate what you have not named.
1. Transport waste
Unnecessary movement of goods, documents, or information that adds no value. Goods moved, staged, moved again, and restaged before the value adding step ever begins. In office operations, the email chain that should have been one decision.
2. Inventory waste
Holding more stock, data, or work in progress than the operation needs. Backlogged tasks, over engineered documentation, and information hoarded in inboxes all slow throughput.
3. Motion waste
Unnecessary physical or digital movement by operators. Poor layout that forces long walks between picks, or workflows that require 6 screens for an action that should take 2. Entirely eliminable through layout and workflow design.
4. Waiting waste
Time spent inactive while waiting for input, approval, information, or materials. Waiting for the inbound manifest, for purchase order approval, or for a supervisor to authorise an exception a documented process would handle automatically.
5. Over processing waste
Performing more work than the next step requires. Quality checks on every item where sampling would do. Reports run weekly when monthly suffices. Created by well intentioned people doing more than the process specifies.
6. Defects waste
Errors, mis picks, and non conformances requiring rework. Each defect costs 3 to 7 times more to correct than to prevent. A 7.3 percent error rate means 1 in 14 orders has a problem, a direct retention liability.
7. Knowledge waste
The most underrecognised waste: operational expertise held in individuals' heads, neither documented nor transferred. It creates single points of failure, inconsistent performance, and long ramp times. It compounds most expensively as the operation grows.
The method
The OPTIC Framework: five phases, in sequence
Each phase builds on the previous. Observe produces the data Pinpoint analyses. Pinpoint produces the backlog Transform acts on. Transform produces the processes Integrate connects. Integrate produces the system Calibrate measures.
Observe: map the current state first
The most expensive mistake in efficiency work is launching initiatives before completing a current state process map. The Observe phase has three components: process mapping (every step, decision, handoff, and wait state in your 3 to 5 most critical workflows), time analysis (how long each step takes and what share is value creating), and exception cataloguing (the 10 to 15 most common deviations and their frequency).
It is built by watching the operation actually work, not by interviewing managers or reading procedures. For a 20 to 30 person operation it takes 5 to 10 working days. A logistics initiative that reorganises layouts or buys technology before this map is the equivalent of a surgeon cutting before ordering imaging.
Pinpoint: find the 20% that drives 80% of the gain
The Pinpoint phase converts the current state picture into a prioritised action list by applying three filters to every inefficiency: Impact (how much time, cost, or customer outcome is affected per occurrence), Frequency (how often it happens), and Fix Complexity (how hard it is to address and what depends on it).
The output is a rank ordered improvement backlog, grouped into 30 day sprint batches. This prevents the scattergun approach that produces marginal gains everywhere instead of transformative gains in the highest value areas.
Transform: improve in measurable 30 day sprints
The Transform phase turns the backlog into reality through 30 day sprints, each with defined improvements, metrics, and a retrospective. The first sprint always focuses on process documentation and exception standardisation: the lowest complexity, highest frequency improvements that need minimal capital and show visible gains within 2 to 3 weeks.
You cannot improve what is not yet standardised, and you cannot measure against a baseline that does not exist. We document standards and sprints in ClickUp so every change has an owner, a metric, and a review date. The sequencing is non negotiable: process first, technology second. Technology that automates a poorly designed process produces automated waste.
Integrate: connect processes across handoffs
Efficiency is created or destroyed at the connections between processes: the handoffs where goods, information, or responsibility transfer from one operator, team, or system to another. A perfectly optimised pick connected to a poor pack handoff produces a bottleneck that offsets the pick gain entirely.
The Integrate phase maps every significant handoff and asks four questions: what transfers, in what format, confirmed by whom, within what timeframe. It also builds the single source of truth for order status, inventory, and exceptions. In practice this is a shared operational dashboard, built in Notion or Monday, that eliminates the status request interruptions consuming 8 to 12 percent of supervisor time.
Calibrate: build the loop that compounds gains
An efficiency improvement without measurement is a temporary adjustment. With consistent measurement it becomes a new standard that improves with each review cycle. The Calibrate phase installs three measurement layers: daily operational metrics (orders vs target, pick accuracy, exception volume, on time dispatch), weekly process health metrics (error rate by step, time per order, handoff failure rate), and a monthly strategic review (cost per order, on time delivery, complaint rate, headcount productivity).
Design metrics for the person doing the work, not the person reviewing it. If a picker cannot see their accuracy by midshift and self correct before the shift ends, the system is optimised for reporting, not performance. We push these live dashboards into Monday and surface alerts in Slack so supervisors act inside the shift, not the day after.
The roadmap
The 90 day logistics efficiency sprint
OPTIC is deployed in four stages. Each has defined inputs, outputs, and a stage gate milestone that must be met before the next begins. Skipping stages produces the same result as skipping a building's foundations.
| Stage | Days | OPTIC phases | Stage gate milestone |
|---|---|---|---|
| 1. Diagnose | 1 to 20 | Observe + Pinpoint | Current state maps complete, waste audit scored, improvement backlog ranked and sprint batched |
| 2. Quick Win Sprint | 21 to 50 | Transform (Sprint 1) | Top 5 exception standards deployed, operator training complete, first efficiency baseline captured |
| 3. Foundation Build | 51 to 75 | Transform (Sprint 2) + Integrate | Layout or workflow redesign implemented, handoff standards deployed, shared dashboard live |
| 4. Calibrate and Compound | 76 to 90 | Calibrate | 3 tier measurement system live, weekly ops review running, 90 day improvement vs baseline documented |
Stage 2 demonstrates measurable improvement within 30 days, generating the team confidence and leadership buy in that sustains the longer horizon work. The lived proof that process clarity makes the job easier, not harder, is the cultural asset that makes Stages 3 and 4 achievable. Complex system implementations like a WMS or ERP are scoped in Stage 3 but deployed after 90 days, so the operation is not overwhelmed while the transformation is still consolidating.
The sequencing decision
Technology vs process: get the order right
The 2026 logistics technology market is genuinely impressive: warehouse and transport management systems, route optimisation, RFID tracking, automated picking, AI demand forecasting. Each can produce real gains, when deployed in the right sequence against a sound process foundation.
The right sequence is: design the process first, then select the technology that supports it. The wrong sequence, buying the tool that promises the gain and then fitting the process to it, produces three predictable outcomes: the technology automates existing waste, the implementation becomes an unled process redesign that overruns, and adoption fails because operators learn a new system and a new process at once.
Five questions before any logistics tech investment
Before evaluating any tool, OPTIC requires that you can answer all five affirmatively:
- Is the process this technology supports already documented and functioning acceptably without it? If no, fix the process first.
- Can we quantify the efficiency gap it will close, based on Observe phase data? If no, we are buying on vendor promise.
- Does it integrate with adjacent systems without manual data re entry at handoffs? If no, it creates new integration waste.
- Can operators reach full competency within 5 to 10 working days? If no, the adoption cost may offset the gain.
- Can we measure its contribution independently within 90 days? If no, we cannot validate the ROI.
These are not anti technology filters. They are pro evidence standards. Connecting your stack with Make or n8n only delivers once the underlying workflow is sound. When it is, our Automation stage removes the duplicate data entry and waiting waste that no amount of operator effort can fix.
Proof
7.3% to 1.1% error rate in 90 days
A 28 person regional distribution firm handling FMCG for retail and foodservice, processing 380 to 420 orders a day across two shifts. It had grown from 12 to 28 people in 3 years with no structured process review.
On time delivery had slipped from 84 to 71 percent. Incorrect order complaints had climbed from 2.1 to 7.3 percent. The dispatch team spent 2.5 hours per shift on exception handling that supervisors called "just how it works here," and the operations manager was working 11 to 13 hour days. The OPTIC diagnostic found the pick, pack, and dispatch workflow had 23 steps, of which 8 (35 percent) created no value, and the exception process was entirely undocumented across 14 exception types. The top 3 waste sources were Defects, Waiting, and Knowledge waste.
| Metric | Result at 90 days |
|---|---|
| Order fulfillment time (pick to dispatch) | Reduced 41 percent, from 38 min to 22.4 min per order |
| Order error rate (mis picks, wrong labels) | 7.3 percent to 1.1 percent, down 85 percent |
| On time delivery rate | 71 percent to 94 percent, up 23 points |
| Warehouse throughput (orders per shift) | Up 34 percent, same headcount, two shifts unchanged |
| Cost per order | Down 28 percent, no headcount increase |
| Exception handling time per shift | 2.5 hrs to 0.6 hrs, down 76 percent |
| Operations manager hours per week | 62 hrs to 47 hrs, down 24 percent |
| Customer complaints (incorrect or late) | Down 79 percent over the 90 day period |
At the 90 day review, the operations manager noted the biggest change was not any single metric. "Before the OPTIC work, every shift had 15 to 20 moments where someone needed to find me to make a call on an exception. Now most exceptions are handled without escalation because we have a standard. I am actually managing the operation instead of running around inside it."
That shift, from exception handler to system builder, is the most durable outcome of a well executed transformation. The metrics improve because the role changes. The role changes because the processes are documented. And the processes stay documented because the measurement system makes degradation visible before it becomes a crisis.
FAQ
Questions operations leaders ask
What is the OPTIC Framework for logistics process efficiency?
What are the 7 forms of operational waste in logistics?
How long does it take to see efficiency improvements in logistics operations?
Should I invest in new logistics technology before or after improving my processes?
How do you reduce order errors in a distribution operation?
How do you improve warehouse throughput without adding headcount?
Ishan Vats
Founder, IV Consulting · operations & systems consultant
I build operating systems and automations for growing teams. 150+ ops transformations over 10+ years. If you want yours mapped and built right, I'll do it with you on a free call.
Book a free strategy call →Keep reading
Related guides and work
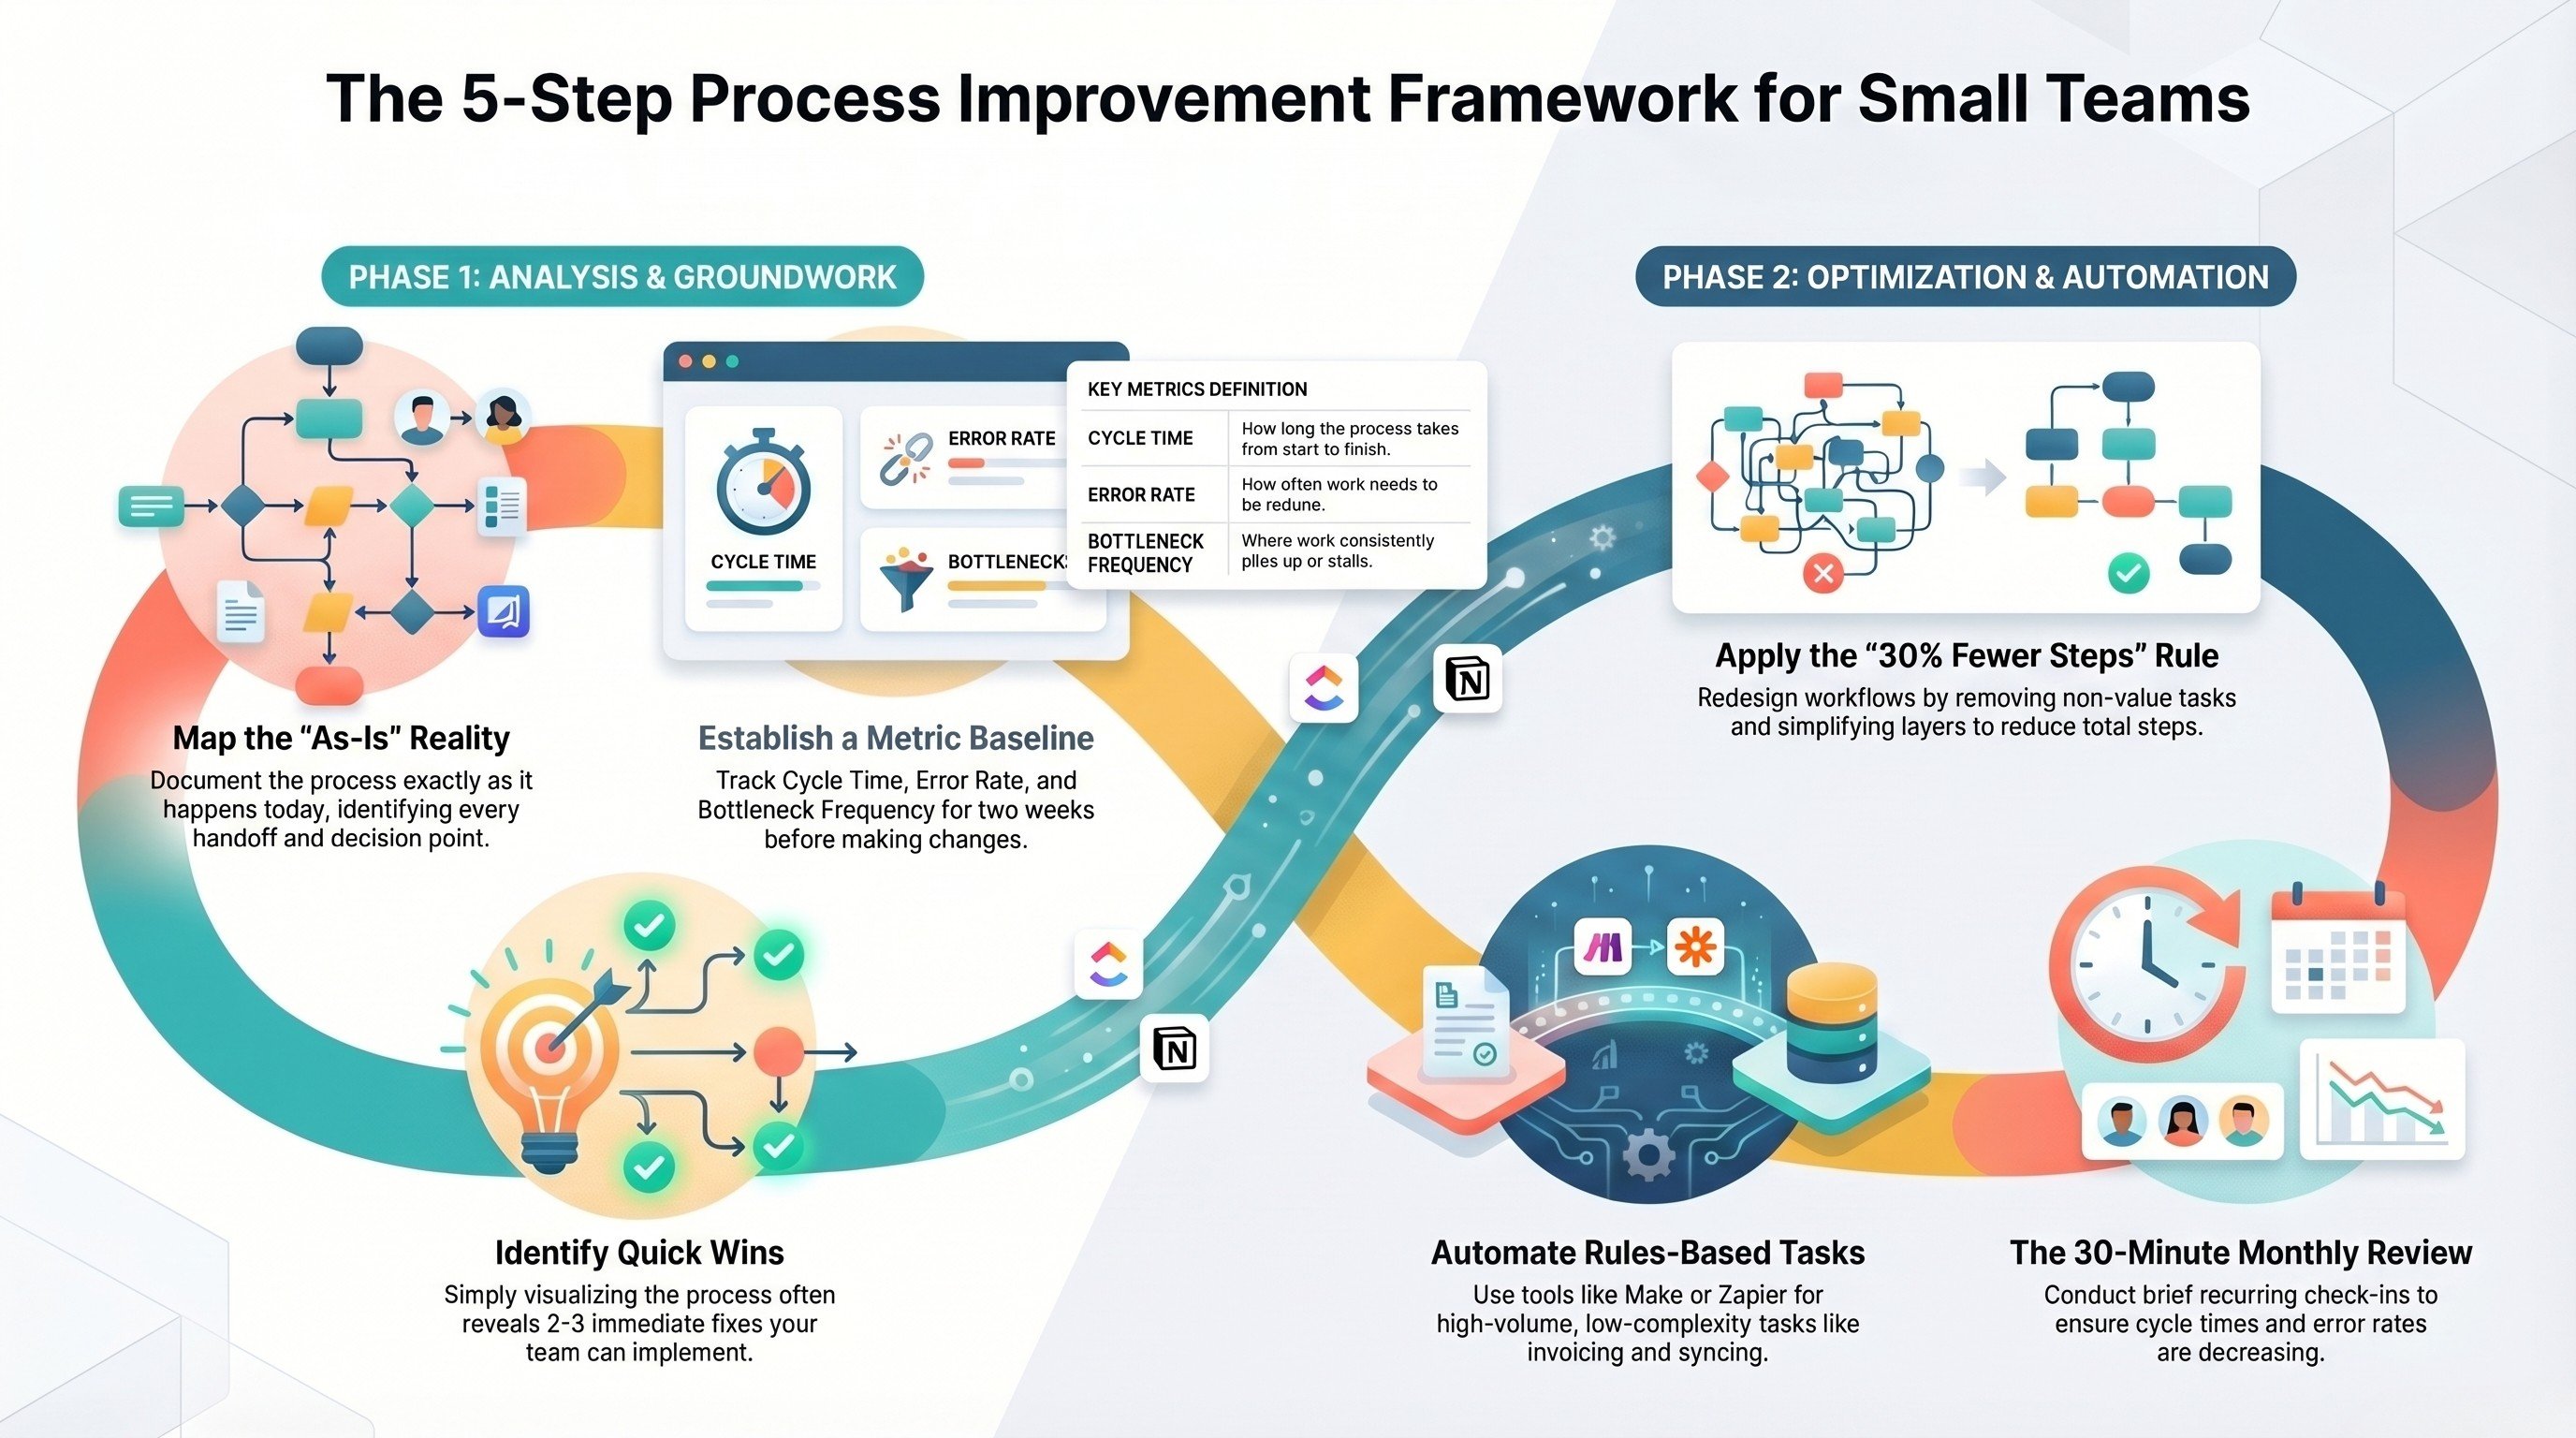
A process improvement framework for small teams
The lightweight system for fixing broken processes without a consultant army.
Read the framework →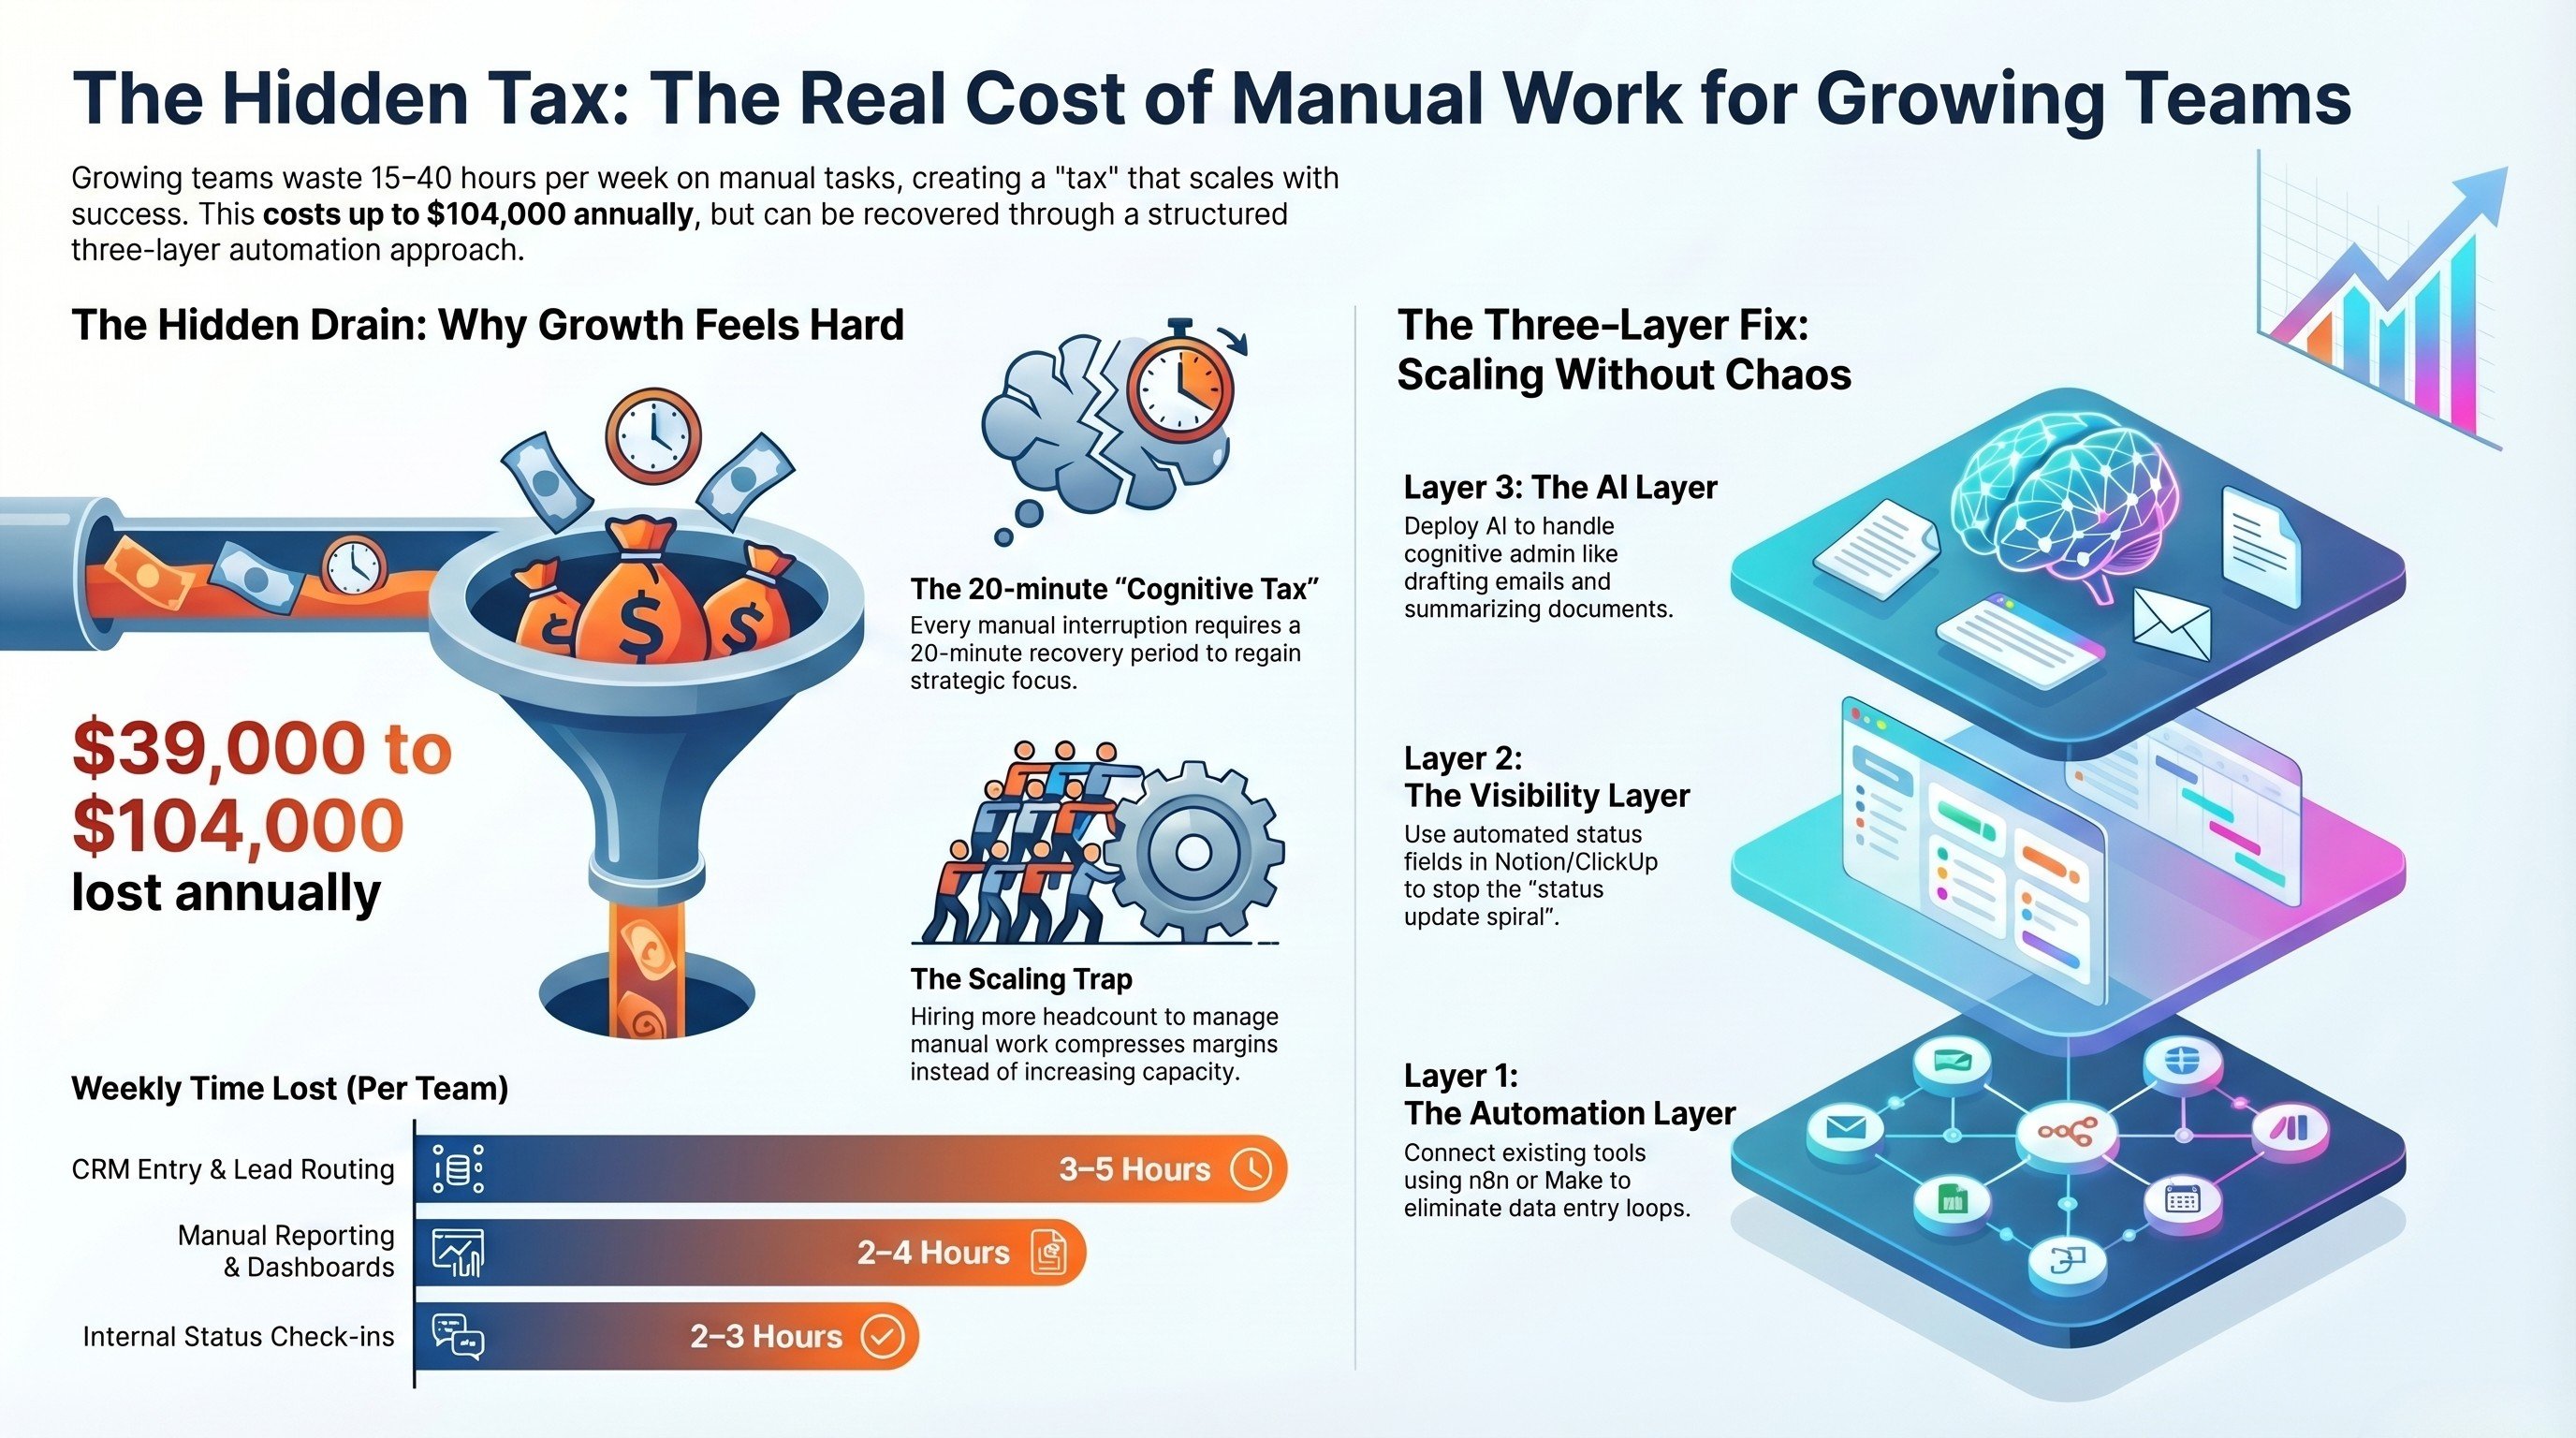
The real cost of manual work for growing teams
What the hidden tax of manual operations is actually costing you each month.
Read the analysis →
The Foundation stage, built for you
We map your operation, name the waste, and design the process before any tool is bought.
See the offer →Want your automation stack built for you?
Book a free 30-minute strategy call. We will map your highest-ROI workflows and give you a build roadmap on the spot. If we are not the right team for you, we will say so and point you somewhere better.
Book a Free Strategy Call →Free 30-minute call. Honest take, even if that means "you do not need us yet."