The fast track to efficient growth for startups: the LEAG Framework
Fast growth and efficient growth are not the same thing. This is the 4-pillar model that lets you scale revenue while your unit economics hold or improve.
 By Ishan Vats · Founder of IV Consulting · 150+ ops transformations over 10+ years
Some links below are affiliate links. If you buy through them we may earn a commission, at no extra cost to you.
 Acquire · Sales processLead enters pipeline
 Amplify · Automation engineSystematise the repeatable work
 IntelligenceMetrics dashboard
 ExecutionPriority architecture
 OnboardingActivation playbook
Efficient growth for startups is revenue and customer growth matched by improving or stable unit economics: CAC, gross margin, Net Revenue Retention, and revenue per employee holding or improving as you scale. The fast track is not slowing down. It is building four operational pillars (Lean Operations, Execution Discipline, Amplification Systems, and Growth Intelligence) so you grow fast without compounding the operational, financial, and human debt that makes every later stage harder and more expensive.
The trap
The two ways startups fail at growth
Every founder wants to grow fast. The culture is saturated with velocity signals: month-over-month growth rates, fundraising milestones, headcount announcements, ARR targets. But there is a version of fast growth that is quietly lethal. Revenue climbs while gross margin shrinks. The team grows while productivity per person falls. Acquisition accelerates while customer lifetime value does not keep up. The engine runs hotter than it can sustain, and the warning lights have been on for months.
Across IV Consulting's work on 150+ business transformations, inefficient fast growth, growing fast in ways that compound costs and create operational debt, is the pattern that most frequently precedes a fundraising crunch, a team crisis, or an emergency restructure. Not slow growth. Not no growth. Fast, inefficient growth that looked great on a slide deck until the numbers underneath it were examined honestly.
Failure Mode 1: Stagnation, growing too slowly to matter
The stagnation failure mode is familiar: the startup cannot find repeatable demand, burns through its seed round on experimentation, and exhausts runway before reaching the growth rate that would justify the next raise. It is painful, but it is transparent. The team knows it has a growth problem, investors can see the trajectory, and decisions get made from a clear-eyed view of the situation.
Failure Mode 2: Inefficient scaling, growing fast in the wrong direction
The inefficient scaling failure mode is less visible and more insidious. The startup is hitting its top-line numbers. Revenue is growing. The team is expanding. But underneath, structural inefficiencies compound. CAC rises with every new sales hire because the sales process depends on individual heroics. Customer success costs climb because onboarding is inconsistent. Gross margins contract because delivery has not been systematised and rework creeps up. Leadership spends 60% of its time on operational management rather than strategic growth.
Efficient growth is the antidote to both modes. It generates the velocity needed to avoid stagnation and builds the operational infrastructure that prevents the structural inefficiencies of unchecked scaling. It is not a compromise between fast and sustainable. It is the mechanism that makes both simultaneously possible.
The definition
What efficient growth actually means
Efficient growth is business expansion where revenue and customer growth is matched by improving or stable unit economics. Specifically, the cost to acquire, the cost to deliver, and the revenue retained per customer are improving, or at minimum holding steady, as you scale.
An efficiently growing startup exhibits four measurable characteristics. They are the operational fingerprint of efficient growth: a startup growing fast but declining on all four is building a structurally expensive business; one growing fast and improving on all four is building a structurally defensible one.
- Declining or stable Customer Acquisition Cost (CAC) as the sales and marketing function matures and processes improve.
- Improving gross margin as delivery is systematised and rework and support costs fall.
- Growing revenue per employee as operational infrastructure amplifies output without proportional headcount growth.
- Improving Net Revenue Retention (NRR) as customer success becomes more proactive and data-driven.
The diagnosis
The 5 hidden growth killers making every dollar cost more
These are the five patterns IV Consulting identifies most consistently across startup engagements. Common, measurable, and highly solvable when caught early.
Growth Killer 1: Founder-dependent sales that cannot scale
The most dangerous growth dependency in early-stage startups is a sales process that only works when the founder is in the room. Their product knowledge and credibility close deals a less senior hire cannot replicate. This feels like a strength. It is actually a structural ceiling on growth velocity and a structural floor on CAC. Until the sales process is documented, coached, and de-personalised enough to be reproducible by a trained hire, every growth target competes against a bottleneck that gets worse with success.
Growth Killer 2: Onboarding that converts customers into support load
A startup with a strong acquisition engine and a leaky onboarding process is filling a bucket with a hole in it. It pays to acquire customers who never reach full value because onboarding is inconsistent, incomplete, or so support-intensive that it consumes operational capacity. IV Consulting finds that startups with undocumented, founder-led onboarding typically carry 2.5x the support ticket volume and 35 to 50% lower activation rates in the first 30 days compared to startups with structured onboarding playbooks.
Growth Killer 3: Hiring ahead of process that amplifies chaos
The instinctive response to operational strain is to hire. It is not wrong as a direction of travel. It is wrong as a first response. Hiring into operational chaos without first documenting and stabilising the underlying processes produces new hires who are slow to ramp, inconsistently effective, and who absorb more senior time in ad hoc training than they contribute in their first 90 days.
Growth Killer 4: Revenue without retention economics
Net Revenue Retention is the single most powerful predictor of long-term startup valuation and funding success. A startup with 115%+ NRR is expanding its revenue base through existing customers faster than churn can erode it. A startup with 80% NRR is losing a fifth of its revenue base annually and running a growth engine that needs constant new acquisition just to stay flat.
Growth Killer 5: Decision-making that slows with scale
In efficiently growing startups, decision velocity is a growth lever. In inefficiently growing ones, decision-making slows with scale, because every significant decision still routes through the same one or two people it did when the company had six employees. The compounding cost is not just the decisions themselves, but the decisions that never get made because the queue is long and the urgency fades: the product iteration delayed three weeks, the partnership never followed up, the obvious process fix never prioritised.
The framework
The LEAG Framework: 4 pillars for efficient startup growth
Each pillar addresses one dimension of growth efficiency: Lean Operations, Execution Discipline, Amplification Systems, and Growth Intelligence. Together they form the infrastructure that lets a startup grow fast without compounding debt.
Lean Operations: extract maximum output before adding headcount
Lean operations is not about being cheap. It is about being precise. Before adding a person, extract the maximum output from the current team by removing the friction, redundancy, and process gaps that reduce effective capacity. IV Consulting finds the average growth-stage startup operates at 60 to 70% of its team's potential productive capacity, because 30 to 40% of team time goes to workarounds, rework, manual processes, and coordination overhead that well-designed operations would eliminate.
The lean operations target for a growth-stage startup is 75%+ of team time on value-producing activities. Moving a 15-person team from 65% to 75% is the equivalent of adding 1.5 full-time employees, without a single hire, salary, or onboarding period. A documented operating system in ClickUp or Notion is usually where that reclaimed capacity gets locked in.
Execution Discipline: the right priorities, relentlessly
Execution discipline is identifying the three to five activities with the highest leverage on growth at the current stage, and protecting the team's time and attention for those above all else. It sounds straightforward. In practice it is the most violated principle in startup operations, because the volume of incoming demands at a growing startup is relentless and, without active discipline, the highest-leverage work gets crowded out by urgent-but-low-leverage tasks.
The three mechanisms are Priority Architecture (a short, written, shared top 3 to 5 growth levers for the quarter with specific targets, not a 20-item OKR list nobody can navigate under pressure), Opportunity Cost Literacy (evaluating every significant time allocation against its opportunity cost, since an 8-hour custom proposal for a prospect who will not close is the 8 hours not spent on three warm referrals), and a Weekly Execution Review (a 45 to 60 minute leadership review asking one question: are our actual resource allocations this week aligned with our stated priorities?).
Amplification Systems: infrastructure that multiplies output
Amplification systems are the processes, tools, and automations that let a startup produce more output from the same team by systematising the repeatable elements of the work. Without them, every growth increment requires a proportional headcount increment. With them, the relationship between headcount and output becomes non-linear. The four highest-leverage systems are Sales Process Systemisation, a Customer Onboarding Playbook, Delivery Standardisation, and Automation Infrastructure.
On that last pillar: identifying and automating the highest-volume, lowest-variance recurring tasks (follow-up sequences, status updates, data transfers, report generation, renewal reminders) with a tool like Make or n8n typically reclaims 5 to 12 hours per week per person. That reclaimed time is the inventory for growth activities.
Growth Intelligence: metrics that predict, not just confirm
Growth Intelligence is the measurement infrastructure that tells you where the engine is working, where it is leaking, and what needs to change, before the problem reaches the lagging indicators board reports are built from. Most startups measure outcomes. Efficiently growing startups measure the inputs and processes that produce outcomes, buying a 4 to 8 week lead time on performance shifts.
The architecture has three layers: Leading Indicators (3 to 5 predictive metrics per growth function, such as trial-to-paid conversion or product activation depth), Unit Economics (CAC, LTV, LTV:CAC, gross margin per customer, payback period, NRR, updated monthly not quarterly), and Operational Health Metrics (time-to-close, time-to-activate, rework rate, decision resolution time, cross-team SLA adherence).
The stage-gated roadmap
The LEAG Framework does not deploy identically across stages. Each pillar is calibrated to the growth stage and the primary bottleneck at that stage.
| Stage | Primary bottleneck | LEAG priority | Key deliverable |
|---|---|---|---|
| Seed (5 to 12 people) | Founder dependency, repeatable sales | L + E | Lean ops audit, sales process v1, priority architecture |
| Early Growth (12 to 25) | Onboarding quality, NRR | A first pillar | Onboarding playbook, delivery standardisation, leading-indicator dashboard |
| Growth (25 to 50) | Unit economics, hiring efficiency | A + G | Full amplification systems, unit economics dashboard, weekly execution review |
| Scale (50 to 100) | Cross-team coordination, investor readiness | Full LEAG | Complete LEAG infrastructure, OKR-to-process alignment, board-ready metrics pack |
The instruments
The 8-metric Growth Intelligence Dashboard
The minimum viable measurement set IV Consulting deploys at the Growth stage (25 to 50 people). Each metric is defined, measured monthly, and reviewed against prior-period trajectory.
1. CAC by channel
Identifies which acquisition channels are becoming more or less efficient as you scale. Rising CAC is the earliest signal of growth inefficiency, and the reason it leads the dashboard.
2. LTV:CAC ratio
The fundamental unit economics metric. Below 3:1 means you pay too much to acquire customers relative to what they return. Track trajectory, not just level.
3. CAC payback period
How long to recoup the cost of acquiring a customer. For efficient SaaS: under 18 months. Longer payback means growth is more capital-intensive than necessary.
4. Net Revenue Retention
Tells you whether your current customer base is growing, holding, or shrinking in revenue. Above 110% is excellent. Below 90% is a structural growth problem.
5. Revenue per employee
The efficiency of headcount investment. Hold or improve it as you hire. Declining revenue per employee signals that hiring is outpacing productive capacity.
6. Gross margin (blended)
Measures whether delivery is becoming more or less efficient. Declining gross margin under growth is the signature of delivery processes that were never systematised.
7. Sales conversion by stage
Pinpoints where deals fall out of the pipeline. Falling conversion at a specific stage is a coaching and process signal, not a headcount signal.
8. 30-day activation rate
The leading indicator for NRR and LTV. Low activation in the first 30 days predicts churn; high activation predicts expansion. The fastest return on any retention investment.
The proof
How an 18-person SaaS startup cut CAC 44% and doubled ARR
An 18-person B2B SaaS startup in the workflow automation space was growing but carrying concerning unit economics. The founding team had driven initial ARR through founder-led sales and a strong network. A first cohort of three sales hires was underperforming forecast. Onboarding was consuming 60% of one senior engineer's time. Churn ran at 2.3% monthly (roughly 28% annually). At the current trajectory, CAC payback was 27 months and the LTV:CAC ratio was 1.8:1, well below the 3:1 threshold that would make the growth model fundable at Series A. IV Consulting was engaged for a 16-week growth operations engagement.
What was built (weeks 1 to 16)
- Lean ops audit: identified 22% of team time recoverable through process fixes and automation; engineering onboarding support reduced from 60% to 14% of one engineer's time.
- Priority architecture: the founder's active initiatives cut from 14 to 5; sales team given a clear ICP definition and stage-by-stage qualification criteria.
- Sales playbook v1: documented discovery framework, objection handling, proposal template, and closing protocol, deployed with a 3-week training program.
- Onboarding playbook: an 8-step, 21-day structured onboarding with success milestones at days 3, 7, 14, and 21, plus an activation checkpoint with automated escalation if missed.
- 9 automations deployed: follow-up sequences, onboarding status updates, invoice generation, renewal alerts, and a weekly usage digest to customer success.
- Growth Intelligence Dashboard: all 8 core metrics tracked monthly, with 30-day activation rate added as the primary leading indicator for NRR and unit economics reviewed bi-weekly.
| Metric | Before | After (11 months) |
|---|---|---|
| ARR | Baseline | +103% (more than doubled) |
| Customer Acquisition Cost | Baseline | Reduced 44% |
| CAC payback period | 27 months | 13 months |
| LTV:CAC ratio | 1.8:1 | 4.3:1 |
| Monthly churn rate | 2.3% | 0.9% |
| 30-day activation rate | 41% | 79% |
| Revenue per employee | Baseline | +62% (headcount grew 24%) |
| Series A (month 14) | Not fundable | Closed, oversubscribed |
Revenue doubled. Headcount grew 24%. Revenue per employee improved 62%. The LTV:CAC ratio moved from sub-fundable to benchmark-beating, and churn halved. None of this required a new product, a new market, or a new founding team. It required building the operational infrastructure that made the existing growth motion efficient rather than expensive. The lead investor cited the unit economics improvement as the primary investment thesis.
FAQ
Efficient growth for startups, answered
What is the difference between fast growth and efficient growth for startups?
What is the LEAG Framework for startup growth?
How do you grow a startup fast without burning out the team?
What are the most important growth metrics for an early-stage startup?
When should a startup hire to support growth versus optimise existing operations?
How does operational efficiency affect Series A fundraising readiness?
Ishan Vats
Founder, IV Consulting · operations & systems consultant
I build operating systems and automations for growing teams. 150+ ops transformations over 10+ years. If you want yours mapped and built right, I'll do it with you on a free call.
Book a free strategy call →Keep reading
Related guides and work
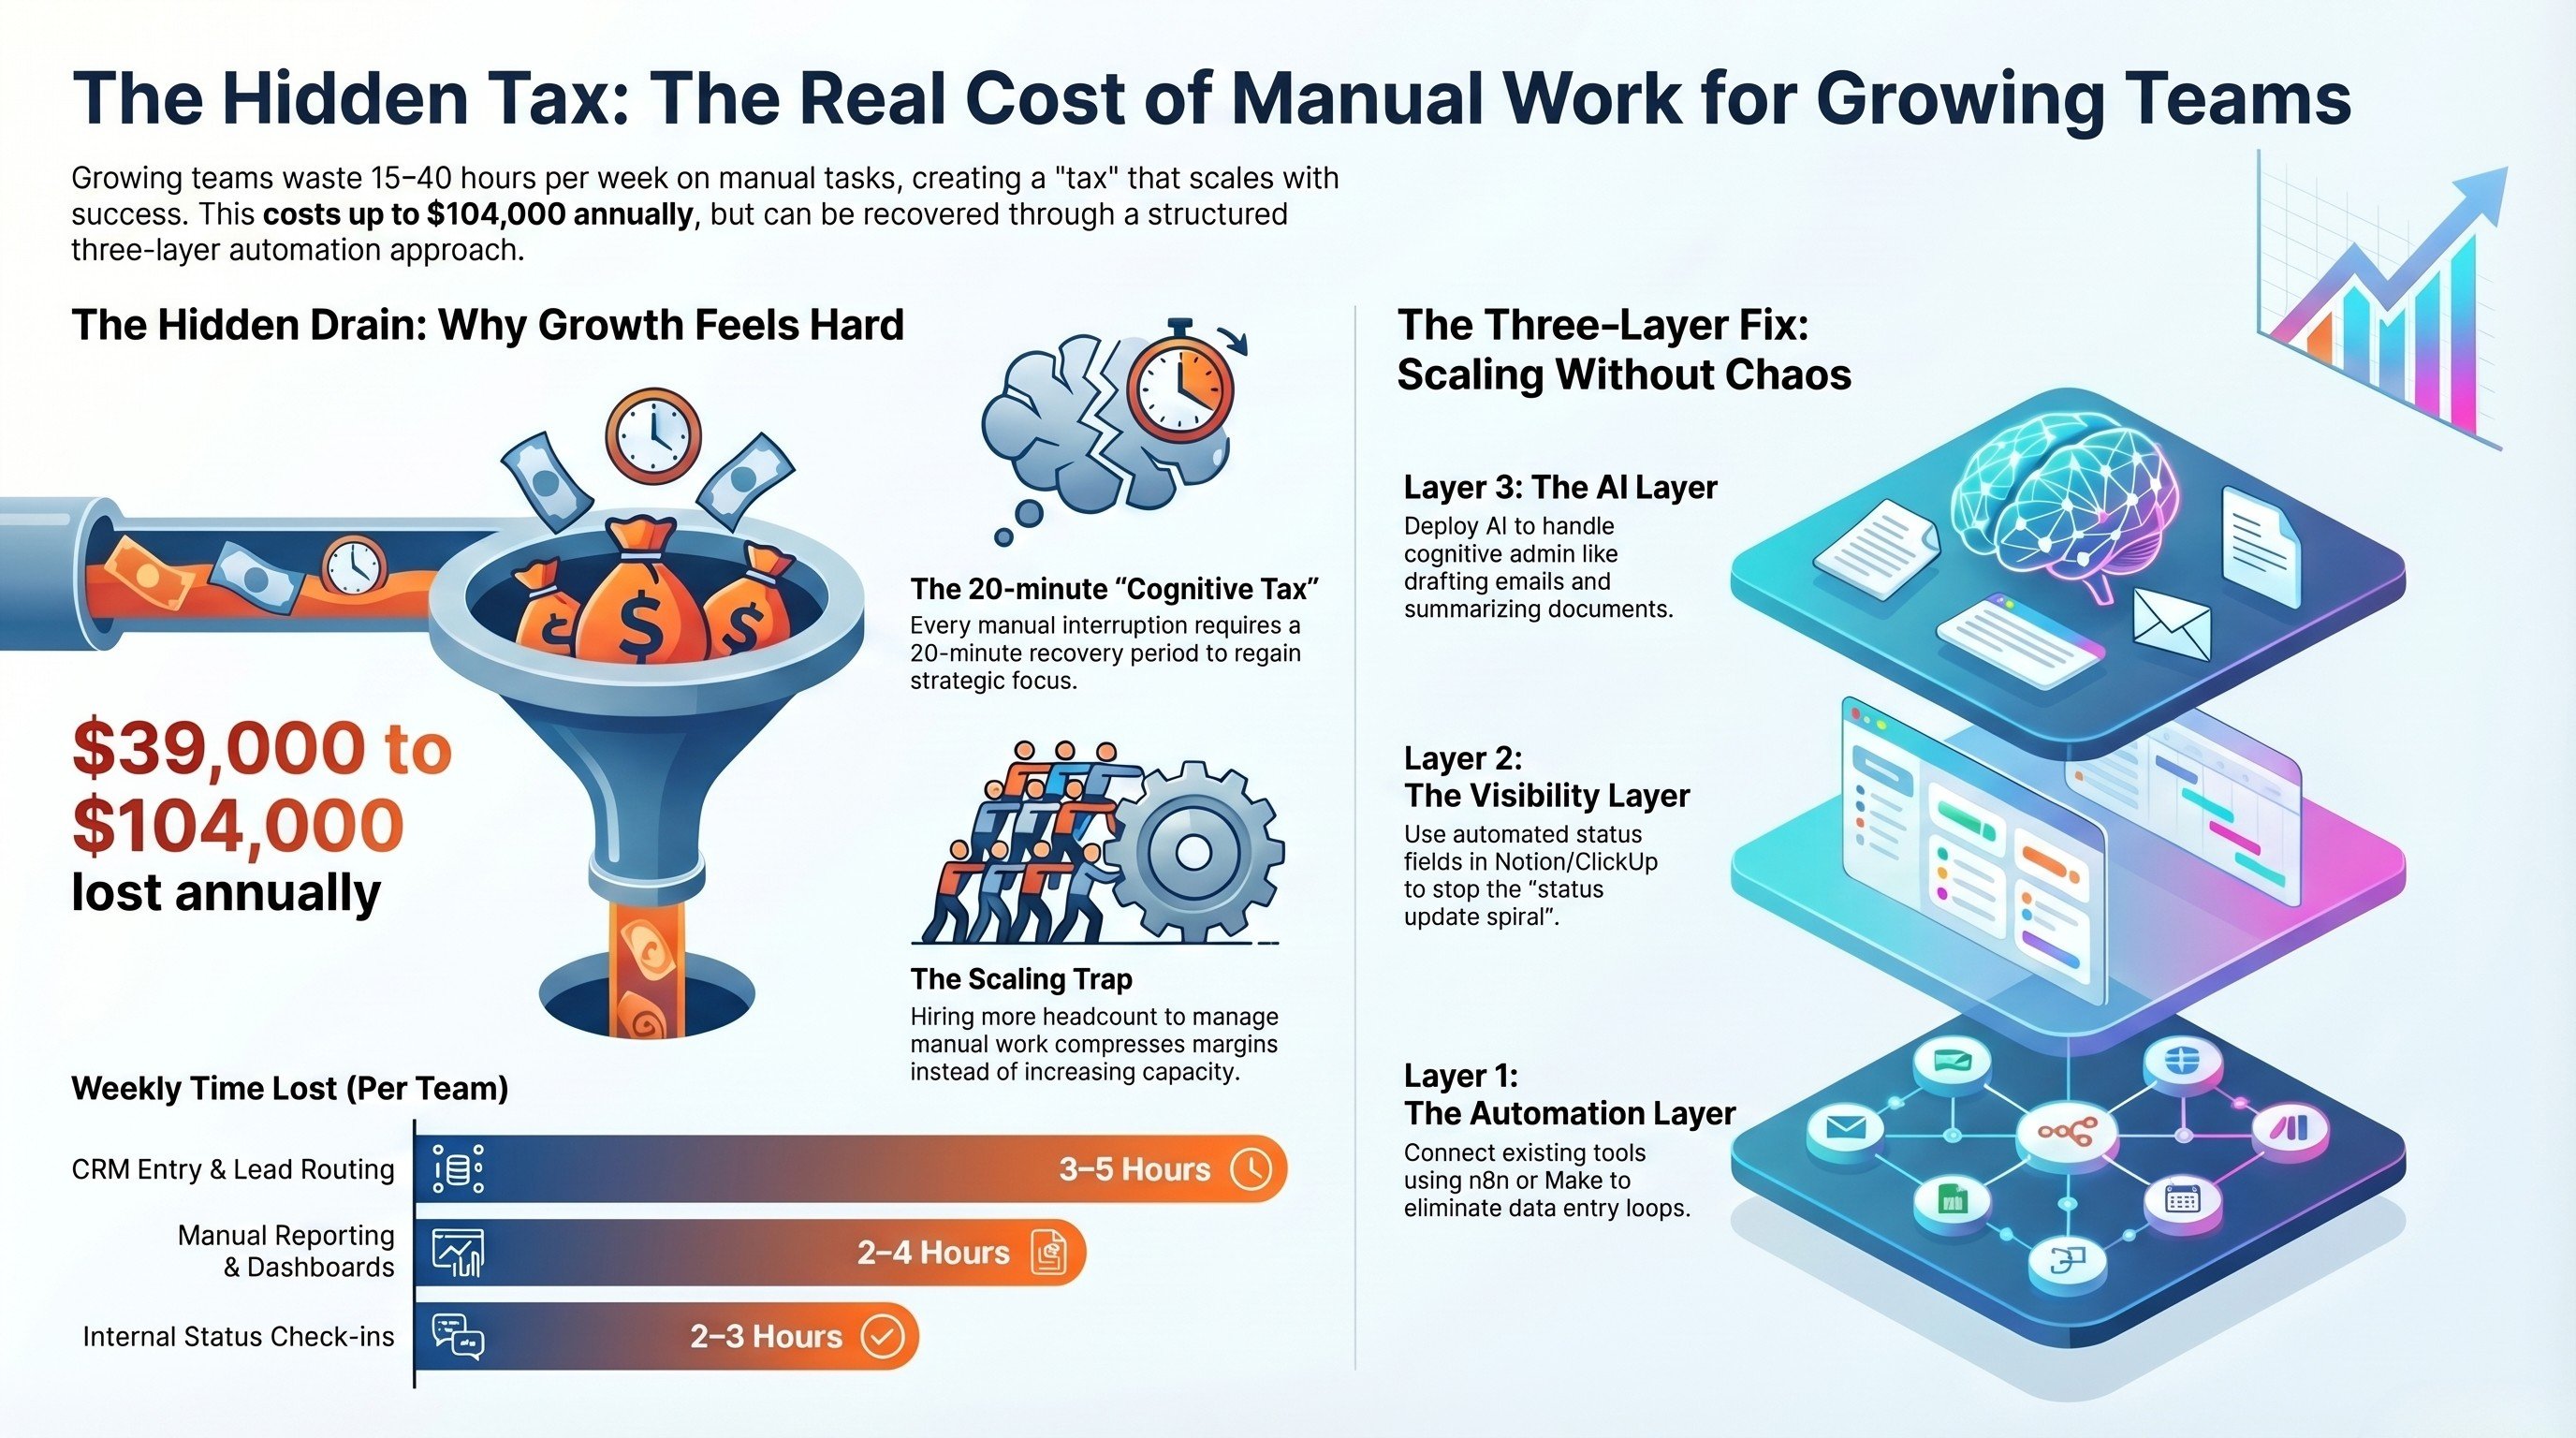
The real cost of manual work for growing teams
Where the hidden hours go, and what they cost you in margin as you scale.
Read the analysis →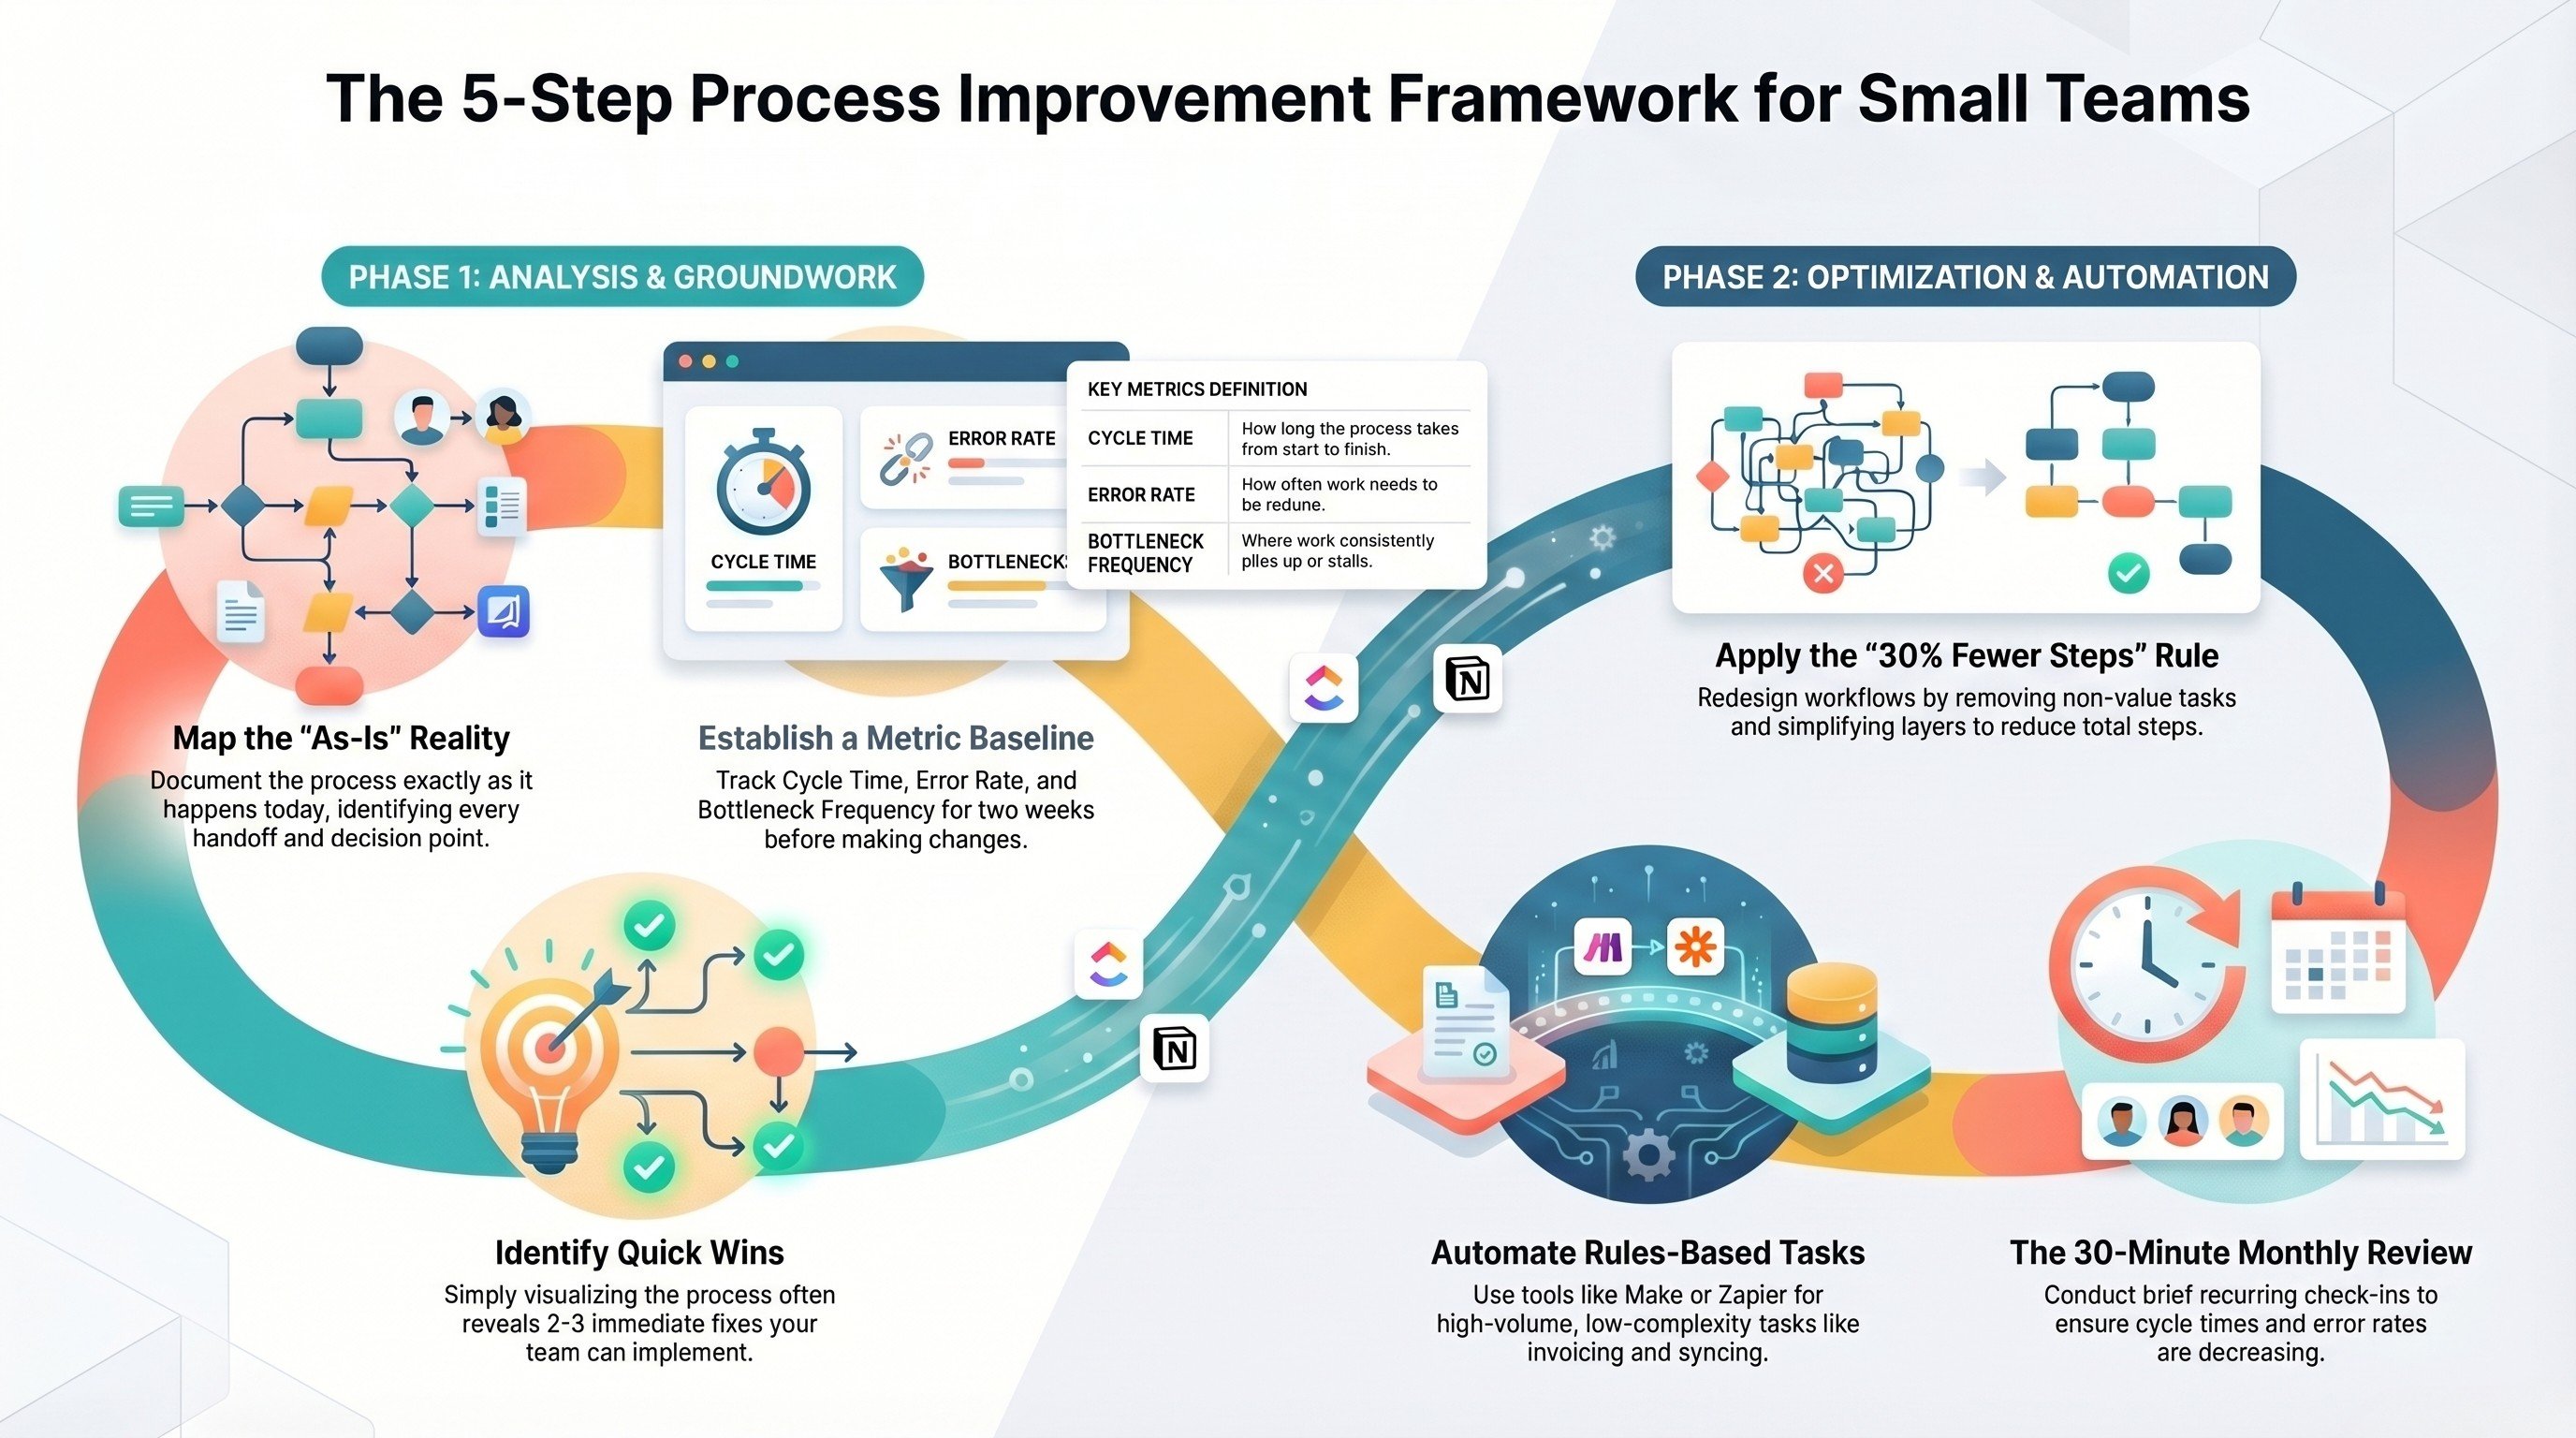
A process improvement framework for small teams
How to find, fix, and document the broken processes before you hire into them.
Read the framework →
The Foundation stage, built for you
The operational base for efficient growth: your systems mapped, documented, and ready to scale.
See the offer →Want your automation stack built for you?
Book a free 30-minute strategy call. We will map your highest-ROI workflows and give you a build roadmap on the spot. If we are not the right team for you, we will say so and point you somewhere better.
Book a Free Strategy Call →Free 30-minute call. Honest take, even if that means "you do not need us yet."