The benefits of optimized project management: 8 outcomes and what they are worth
Project management is not overhead. Optimised, it is a margin protection system. Here are the eight measurable benefits and the framework that captures them.
 By Ishan Vats · Founder of IV Consulting · 150+ ops transformations over 10+ years
Some links below are affiliate links. If you buy through them we may earn a commission, at no extra cost to you.
 Delivery OSClickUp
 Knowledge + briefsNotion
 PortfolioMonday
 TasksAsana
Optimized project management is the state where delivery is consistently on scope, on time, and at or above target margin. It produces eight measurable benefits: higher margins, faster cycles, better utilisation, higher retention, lower rework, scalable capacity, faster onboarding, and sharper management visibility. Across IV Consulting engagements the combined value compounds into a 12x to 28x return, because the revenue, the team, and the capacity are already there. Optimisation simply makes better use of them.
The reframe
What optimized project management actually is
Project management is treated as overhead in most organisations. A necessary cost. The administrative layer between the work and the client. Leaders invest in it reluctantly, staff find it burdensome, and the ROI is never clearly articulated, so it is never clearly optimised.
That framing is costing you. Optimized project management is not administration. It is the operating system that determines whether your team delivers at margin, whether your clients renew, whether you can grow without hiring proportionally, and whether your people can do their best work rather than spending half their energy compensating for process gaps. In IV Consulting engagements, the average project-driven organisation running unoptimised PM leaves between 9 and 17 points of margin on the table, every year.
The definition
Optimized project management is the state in which project delivery is consistently on scope, on time, and at or above target margin, through structured processes, clear accountability, real-time visibility, and continuous calibration. It is not about using the most sophisticated tools or following a rigid methodology. It is about designing a delivery system that produces predictable outcomes at the scale and complexity at which your organisation operates.
The model
The APEX Framework for optimized PM
IV Consulting developed APEX to give organisations a clear model for what project management optimisation actually produces, and to diagnose which of four dimensions is most constraining for their specific delivery environment.
A · Alignment
Projects connected to business outcomes, not just delivery metrics. Outcome-linked briefs and client business reviews keep delivery tied to the value the client actually bought.
P · Predictability
Consistent delivery within scope, time, and budget. Real-time cost visibility and structured scope change triggers protect margin before it leaks.
E · Execution Velocity
Faster delivery cycles without quality sacrifice. Standardised workflows and same-day decision velocity remove the wait time that slows projects down.
X · eXpansion Capacity
The ability to scale delivery volume without proportional headcount growth. High utilisation and efficient handoffs create headroom in the existing team.
The payoff
The 8 measurable benefits of optimized PM
These are not theoretical improvements. They are quantified, measurable outcomes IV Consulting observes in every optimisation engagement. Each maps to an APEX driver.
1. Higher project margins
The most direct financial benefit is margin improvement. Unoptimised PM allows three margin leaks to run at once: scope creep absorbed without commercial conversations, rework costs absorbed into project budgets, and resource inefficiency from poor utilisation planning. In IV Consulting benchmarks, unoptimised PM accounts for an average of 11 points of margin leakage, recoverable through structured scope control, real-time hours tracking, and utilisation management. Organisations with these mechanisms achieve 12 to 18 percent higher project margins than peers without them. (APEX driver: Predictability.)
2. Faster delivery cycles
Optimised PM reduces cycle time two ways: process efficiency (removing non-value-adding steps and handoff wait time) and decision velocity (making scope confirmations, resource allocations, and approvals on the same day they are needed). Organisations with optimised workflows achieve 23 to 34 percent faster average project cycle times, which means higher revenue per resource per year. (APEX driver: Execution Velocity.)
3. Better resource utilisation
Utilisation is one of the most significant financial levers in project-driven businesses. In unoptimised environments, rates of 55 to 65 percent are common. Optimised planning, with visibility across all concurrent projects and proactive gap identification, consistently reaches 70 to 80 percent with the same headcount: a 15 to 25 percent productivity increase from the existing team. A team of 20 at 75 percent utilisation delivers three more FTEs of output than the same team at 60 percent, without a single new hire. (APEX driver: eXpansion Capacity.)
4. Higher client retention and renewal
On-time delivery builds the trust that makes renewal easy, proactive communication prevents the surprises that damage satisfaction, and consistent quality drives expansion and referral. Organisations that move from below-average to above-average PM quality see renewal rate improvements of 14 to 22 percentage points within 12 months, a compounding benefit that grows with every renewal cycle. (APEX driver: Alignment + Predictability.)
5. Lower rework rates
Rework is among the most quantifiable costs of unoptimised PM, with a direct cost in repeated hours and an indirect cost in delayed delivery and reduced morale. Organisations with clear brief standards, structured quality checkpoints, and defined first-pass acceptance criteria achieve rework rates of 3 to 6 percent of total project hours, compared to 14 to 22 percent in unoptimised environments. On a 20-person team, closing that gap frees 1.5 to 2 full-time resources. (APEX driver: Execution Velocity.)
6. Scalable delivery capacity
One of the most undervalued benefits is growing delivery volume without a proportional increase in headcount. In unoptimised environments, every 20 percent increase in volume requires a near-equivalent increase in staffing. Optimised systems create headroom: IV Consulting client data shows organisations absorb an average of 28 percent additional delivery volume after an optimisation engagement, without new hires. (APEX driver: eXpansion Capacity.)
7. Faster team onboarding
Documented, standardised processes dramatically reduce the time new team members need to reach full productivity. Where tribal knowledge is the main onboarding mechanism, new starters absorb undocumented practices over weeks. Optimised environments with documented workflows and structured onboarding cut time-to-full-productivity by 40 to 60 percent, and reduce the cost of departures: when processes are documented, losing a senior team member does not mean losing the process knowledge they carried. (APEX driver: Alignment.)
8. Better management visibility and decision-making
Optimised PM replaces instinct-based management with evidence-based management. Leaders who see real-time project health, utilisation, margin trajectory, and satisfaction data across the portfolio make better decisions faster, before problems compound. The shift from weekly status meetings to real-time dashboards typically cuts leadership meeting time by 40 to 60 percent while improving decision quality. Leaders with portfolio-level visibility identify at-risk projects an average of 12 days earlier. (APEX driver: Alignment + Predictability.)
Before and after
Optimisation benchmarks by benefit
Typical pre-optimisation benchmarks alongside post-optimisation industry ranges, with the APEX driver for each benefit.
| Benefit | Post-optimisation range | Typical unoptimised | APEX driver |
|---|---|---|---|
| Project margin | 29 to 37% (+11 pts typical) | 18 to 24% average | Predictability |
| Delivery cycle time | 23 to 34% faster | Baseline | Execution Velocity |
| Resource utilisation | 70 to 80% (+15 to 25 pts) | 55 to 65% | eXpansion Capacity |
| Client renewal rate | 82 to 89% (+14 to 22 pts) | 68 to 74% | Alignment + Predictability |
| Rework rate | 3 to 6% of project hours | 14 to 22% of project hours | Execution Velocity |
| Delivery volume capacity | +28% same headcount | Baseline | eXpansion Capacity |
| Onboarding to full output | 4 to 6 weeks (-40 to 60%) | 8 to 12 weeks | Alignment |
| Risk detection lead time | 12 to 18 days before impact | 5 to 8 days before impact | Predictability |
Proof
How a 37-person consultancy recovered annual value
A 37-person technology consultancy was growing at 18 percent per year but had watched its operating margin decline from 24 percent to 19 percent over the same period. The MD's hypothesis was that growth itself was the problem. An IV Consulting APEX assessment revealed the actual cause: all four APEX dimensions were underperforming simultaneously, creating a compounding drain on margin that was accelerating rather than stabilising.
The assessment scored Alignment at 2 out of 5 (projects not connected to client business outcomes), Predictability at 2 out of 5 (on-time delivery at 62 percent, scope change rate untracked), Execution Velocity at 2 out of 5 (average delivery 31 percent over original estimate), and eXpansion Capacity at 1 out of 5 (utilisation at 58 percent, no scalable process infrastructure).
The APEX optimisation
Over a 10-week engagement, IV Consulting implemented targeted improvements across all four dimensions. Alignment: outcome-linked project briefs and quarterly client business reviews. Predictability: real-time dashboards with defined scope change triggers and a formal change order workflow. Execution Velocity: standardised the three most common delivery workflow types, cutting average setup time by 67 percent and eliminating four non-value-adding approval steps. eXpansion Capacity: redesigned resource allocation around visible utilisation targets, with a fortnightly capacity review replacing ad hoc resourcing.
| Metric | After APEX | Before APEX |
|---|---|---|
| Project margin | 31% (+12 pts) | 19% |
| On-time delivery rate | 89% (+27 pts) | 62% |
| Resource utilisation | 74% (+16 pts) | 58% |
| Client NPS | 64 (+23 pts) | 41 |
| Rework rate | 4% (-10 pts) | 14% |
| Renewal rate | 86% (+15 pts) | 71% |
| New staff onboarding time | 5 weeks (-50%) | 10 weeks |
| Delivery volume, same headcount | +31% capacity | Baseline |
Diagnose
Which benefits are you leaving on the table?
Score each statement from 0 (never true) to 3 (always true), then total your score and use the bands below.
- Our projects consistently deliver at or above their target margin, and we track this at the individual project level.
- We can identify which active projects are at risk of overrun more than two weeks before the deadline.
- Scope changes trigger a structured commercial conversation, not a silent task addition.
- Our team utilisation across all concurrent projects is visible daily and above 70 percent on average.
- Our rework rate is below 6 percent of total project hours, and we measure it.
- We can absorb a 20 percent increase in project volume without adding headcount.
- A new team member can execute our core delivery processes within four weeks of joining.
- Our client renewal rate is above 80 percent and we understand the specific drivers of every churn event.
- Senior leaders have a portfolio-level view of project health that does not require a status meeting to produce.
- Our average project delivery cycle time has measurably decreased in the last 12 months.
| Your score | Priority action |
|---|---|
| 25 to 30: Optimised | Focus on calibration. Use APEX benchmarks to identify your next 2 to 3 point margin gains. |
| 17 to 24: Partially optimised | Identify which APEX dimension is most constrained and fix it before broadening. |
| 9 to 16: Under-optimised | Conduct an APEX assessment. Multiple benefits are being left on the table at once. |
| 0 to 8: Unoptimised | Book an IV Consulting ops audit. You have 9 to 17 points of margin available to recover. |
FAQ
Questions people ask about optimized PM
What are the main benefits of optimized project management?
What is the ROI of optimizing project management?
How does optimized project management improve client retention?
What is the APEX Framework for project management?
How long does it take to see the benefits of project management optimisation?
What is the difference between project management and optimized project management?
Ishan Vats
Founder, IV Consulting · operations & systems consultant
I build operating systems and automations for growing teams. 150+ ops transformations over 10+ years. If you want yours mapped and built right, I'll do it with you on a free call.
Book a free strategy call →Keep reading
Related guides and work
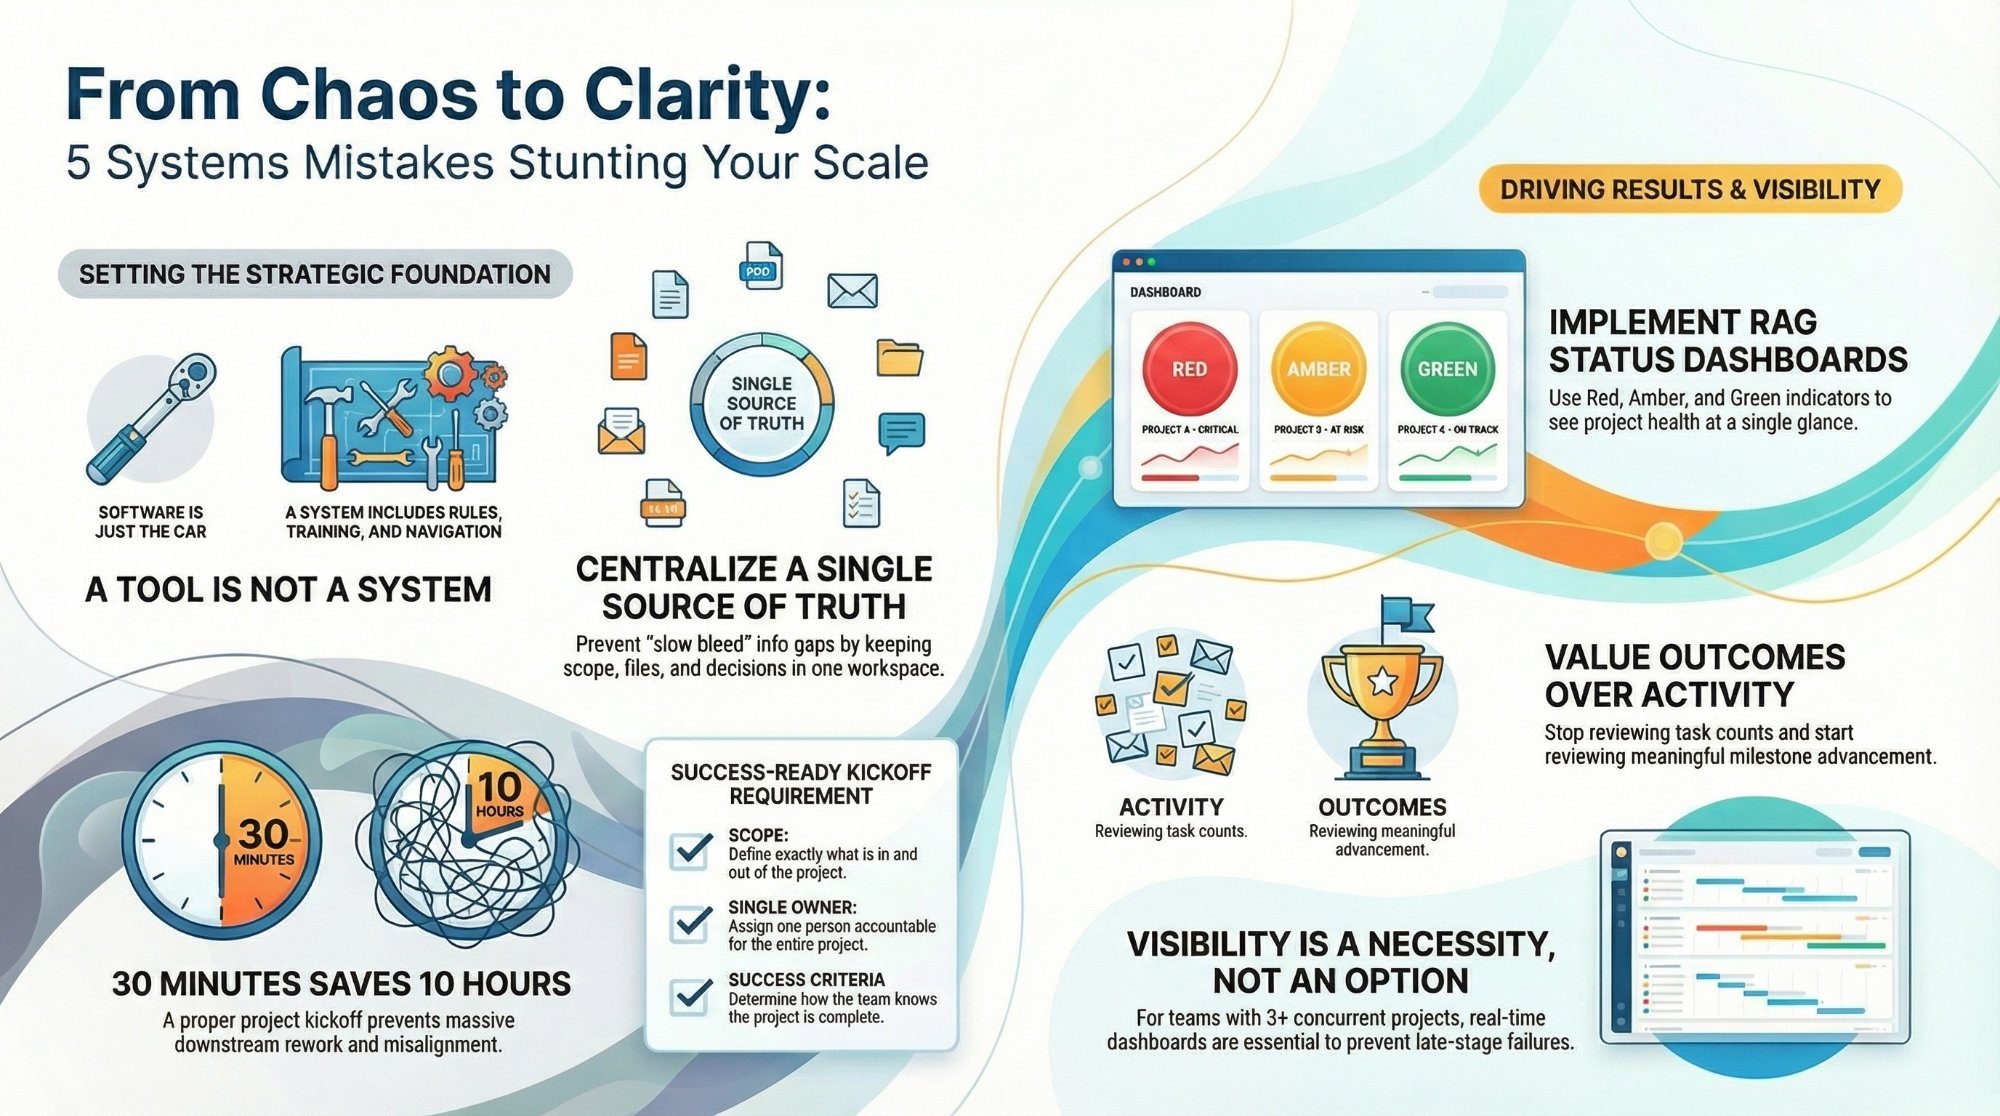
Top 5 project management mistakes CEOs make
The avoidable errors that quietly drain margin from project-driven teams.
Read the guide →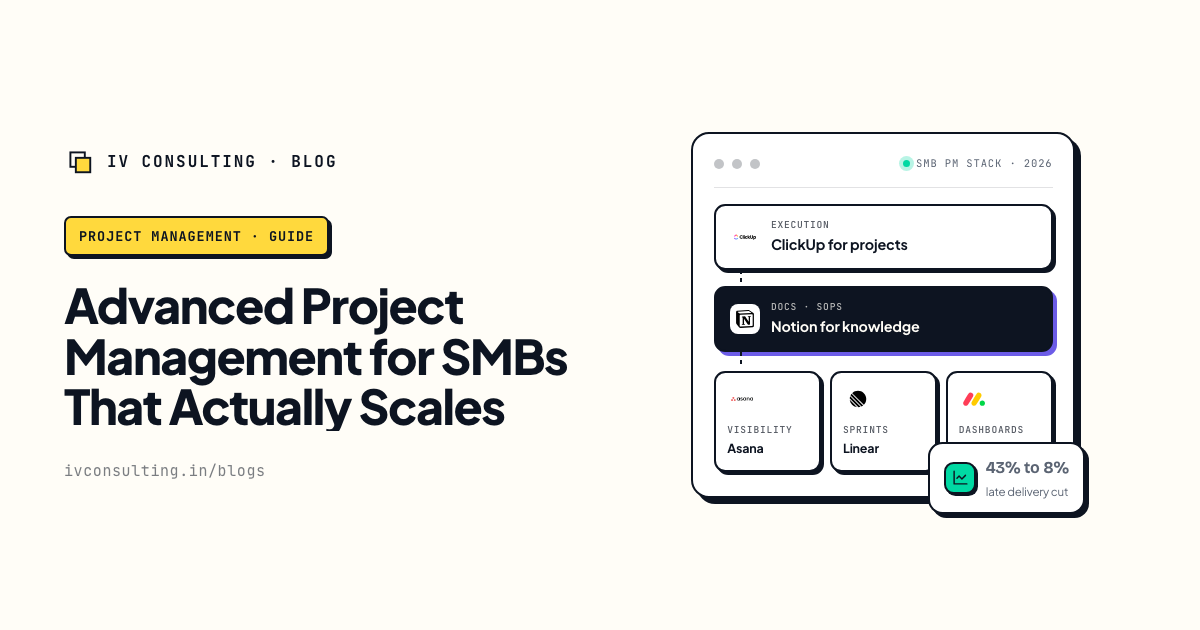
Advanced project management for SMBs
How smaller teams build a delivery system that scales without proportional hiring.
Read the playbook →
The Foundation stage, built for you
Your delivery system designed, documented, and installed for predictable margin.
See the offer →Want your automation stack built for you?
Book a free 30-minute strategy call. We will map your highest-ROI workflows and give you a build roadmap on the spot. If we are not the right team for you, we will say so and point you somewhere better.
Book a Free Strategy Call →Free 30-minute call. Honest take, even if that means "you do not need us yet."